- Catalogs
- General Photonics
- Polarization Optimized PMD Source - PMDPRO™
Polarization Optimized PMD Source - PMDPRO™

Polarization Optimized PMD Source - PMDPRO™
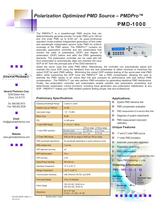
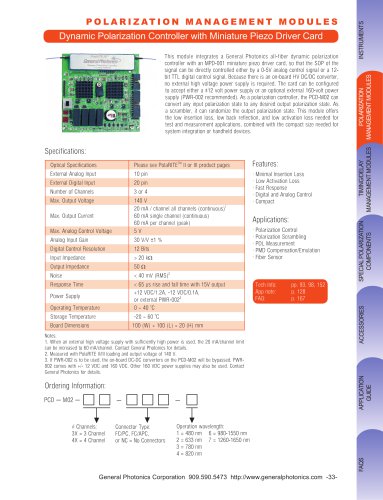
The PMDPro™ operates in the C band or L band with an insertion loss of 5.0 dB at 1550nm. It supports an input power range of −10 to 15 dBm and has a return loss of 50 dB. The device features a Polarization Dependent Loss (PDL) of 0.4 dB typical. The 1st order PMD range is 0 to 91 ps or 0 to 182 ps, with resolutions of 0.357 ps and 0.714 ps in discrete mode, and 0.1 ps and 0.2 ps in quasi-continuous mode. The 2nd order PMD range is 2000 ps² or 8200 ps², depending on the PMD range. The device operates without wavelength dependence in quasi-continuous mode and has a PMD variation time of 1 ms minimum. It supports SOP alignment accuracy of ±2° and SOP tracking speed of 10π/s. The DOP accuracy is ±2%, and it can handle optical power up to 300 mW. Operating temperature ranges from 10°C to 50°C, with storage temperatures from −20°C to 60°C. Communication interfaces include USB, Ethernet, RS-232, and GPIB, with a front panel display of 2 lines, 20 characters. Power supply options are 100-120 VAC or 200-240 VAC, 50-60 Hz. Dimensions are 2U ¾ 19” rack, 3.5”(H) x 14” (W) x 14” (D).
The PMDPro™ is used for system PMD tolerance tests, PMD compensator evaluation, PMD measurement of in-service fiber links, diagnosis of system impairments, and PMD measurement instrument calibration.
It offers 1st and 2nd order PMD source, 1st order PMD emulation, automatic polarization alignment, polarization scrambling, PMD compensation, and PMD determination for in-service fiber links. It allows rapid PMD switching (~1 ms).
The PMDPro™ uses a DSP-based circuit for processing input instructions and controlling the PMD generator and polarization controller. It employs trinary polarization rotation technology and a quasi-continuous rotator for independent DGD and SOPMD control. The device can generate 6561 individual PMD states in discrete mode and independently generate DGD and SOPMD values in quasi-continuous mode.
The PMDPro™ is crucial for testing PMD tolerance in 40G fiber systems. It helps network operators and system vendors evaluate PMD mitigation approaches and perform quality control. The device generates precise PMD values to monitor system performance indicators like BER.
The PMDPro™ evaluates PMD compensators by generating different PMD values and monitoring signal quality. It assesses the compensator's improvement margin, compensation range, and response speed to PMD variations.
The PMDPro™ aids in diagnosing system problems by determining the PMD value of fiber links and assessing the need for PMD compensators. It can also perform PMD emulation by generating statistical PMD distributions.
The PMDPro™ functions as a polarization synthesizer/controller, offering deterministic SOP generation, polarization scrambling, and trace generation for various polarization control needs.
Catalog excerpts
General Photonics Corp. 5228 Edison Ave. Chino, CA 91710 Tel: 909.590.5473 Fax: 909.902.5536 Email: [email protected] Website: www.generalphotonics.com Preliminary Specifications Operating Wavelength Range1 C band or L band Insertion Loss (at 1550nm) 5.0 dB Input power range -10 ~ 15 dBm Return Loss 50 dB P DL 0.4 dB typical 1 st order PMD Range 0 ~ 91 or 0 ~ 182 ps 9 0 ps range 1 80 ps range D iscrete mode 0 .357 ps 0. 714 ps 1 st order PMD resolution Quasi-continuous mode 0.1 ps 0.2 ps 2nd Order PMD Range 2000 ps2 (90 ps range) or 8200 ps2 (180 ps range) PMD wavelength dependence No wavelength dependence in quasi-continuous mode PMD variation time 1 ms min. SOP alignment accuracy ±2° SOP tracking speed 10ð/s DOP accuracy ± 2% Optical Power Handling 300 mW min. Operating Temperature 10 °C to 50 °C Wavelength: C = C band L = L band
Open the catalog to page 1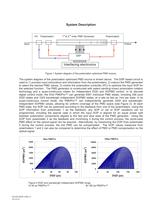
System Description GP-DS-PMD-1000-13 10/14/10 Figure 1 System diagram of the polarization optimized PMD source. The system diagram of the polarization optimized PMD source is shown above. The DSP based circuit is used to 1) process input instructions and information from the polarimeters, 2) instruct the PMD generator to select the desired PMD values, 3) control the polarization controller (PC) to optimize the input SOP for the selected function. The PMD generator is constructed with patent pending trinary polarization rotation technology and a quasi-continuous rotator for independent DGD and...
Open the catalog to page 2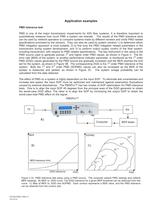
Application examples PMD tolerance test PMD is one of the major transmission impairments for 40G fiber systems. It is therefore important to quantitatively measure how much PMD a system can tolerate. The results of the PMD tolerance tests can be used by network operators to compare systems made by different vendors and verify PMD related specifications promised by the vendors. They can also be used by system vendors 1) to determine which PMD mitigation approach is most suitable, 2) to fine tune the PMD mitigation related parameters in the transceivers during system development, and 3) to perform...
Open the catalog to page 3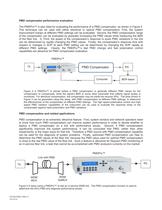
PMD compensator performance evaluation The PMDPro™ is also ideal for evaluating the performance of a PMD compensator, as shown in Figure 4. This technique can be used with either electrical or optical PMD compensators. First, the system improvement margin at different PMD settings can be evaluated. Second, the PMD compensation range of the compensator can be evaluated by gradually increasing the PMD values while measuring the BER of the fiber link. 3) Third, the speed of the compensator’s response to quick PMD variations in the link can be determined by rapidly changing the PMD values. Finally,...
Open the catalog to page 4
1) PMD compensation with either optimized PMD value or user selected PMD value. The PMD compensation is accomplished by maximizing the DOP detected by the polarimeter at the output port. Both PMD and DOP values will be shown on the front panel LCD display. Using the user-selected PMD mode, the user can directly see how the PMD value chosen affects PMD compensation by stepping the PMD values up and down and looking at the maximized DOP values. By comparing the DOP values obtained by polarimeters 1 and 2, the user can determine how well the PMD is compensated. When the optimized PMD mode is selected,...
Open the catalog to page 5All General Photonics catalogs and technical brochures
 Drop In Coupler, NoTail
1 Page
 Fiber Phase Shifter
1 Page
 Polarization Switch
1 Page
 TimeRITE
1 Page
 MPC-201
2 Pages
 ERM-202
1 Page
 PXA-1000
2 Pages
 MPC-202
2 Pages
 WSL-1000
1 Page
 PolaMIX?
1 Page


Archived catalogs
 3 Port Circulator, NoTail
1 Page
 Detector, USB Powered
1 Page
 Bare Fiber Adapter
1 Page
 Fiber Optic Depolarizer
2 Pages
 In Line Isolator, NoTail
1 Page
 Fiber Stretcher
1 Page


- Measuring machine
- Coupler
- LED illumination
- Communication adapter
- Interferometer
- Programmable generator
- Optical coupler
- Power isolator
- Fiber optic coupler
- Optical polarimeter
- USB light source
- Optical isolator
- Polarization measuring system
- Colored light source
- Delay generator
- Delay line
- White light interferometer
- High-speed polarimeter