- Catalogs
- General Electric
- RELIABILITY ANALYTICS
RELIABILITY ANALYTICS
1 /12Pages
RELIABILITY ANALYTICS
1 /12Pages
Catalog excerpts
RELIABILITY ANALYTICS A Failure Elimination Work Process Solution
Open the catalog to page 1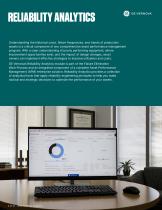
RELIABILITY ANALYTICS Understanding the historical costs, failure frequencies, and trends of production assets is a critical component of any comprehensive asset performance management program. With a clear understanding of poorly performing equipment, where improvement opportunities exist, and the impact of design changes, asset owners can implement effective strategies to improve utilization and costs. GE Vernova’s Reliability Analytics module is part of the Failure Elimination Work Process and an integrated component of a complete Asset Performance Management (APM) enterprise solution. Reliability...
Open the catalog to page 2
PRODUCTION ANALYSIS Most plants contain a hidden plant, which represents the production capacity lost due to inefficient processes and underutilized equipment. Increased profitability hinges upon the ability to identify improvement opportunities, then implement strategies that will increase production. Production Analysis provides an easy method of plotting production output data to evaluate process reliability and calculate production losses related to equipment failures, process slowdowns, and shutdowns. The results of a production analysis can help you pinpoint the source of significant production...
Open the catalog to page 3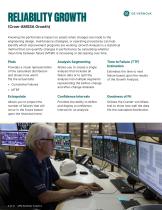
RELIABILITY GROWTH (Crow-AMSSA Growth) Knowing the performance impact on assets when changes are made to the engineering design, maintenance strategies, or operating procedures can help identify which improvement programs are working. Growth Analysis is a statistical method that can quantify changes in performance by calculating whether mean time between failure (MTBF) is increasing or decreasing over time. Analysis Segmenting Provides a visual representation of the calculated distribution and shows how well it fits the actual data: Allows you to create a single analysis that includes all failure...
Open the catalog to page 4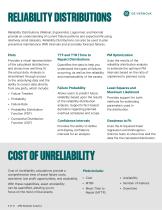
RELIABILITY DISTRIBUTIONS Reliability Distributions (Weibull, Exponential, Lognormal, and Normal) provide an understanding of current failure patterns and expected life using relatively small datasets. Reliability Distributions can also be used to plan preventive maintenance (PM) intervals and accurately forecast failures. Provides a visual representation of the calculated distributions and shows how well they fit the actual data. Analysis is streamlined through access to the underlying data and the ability to censor data directly from any plots, which include: • Failure Timeline • Failure Rate...
Open the catalog to page 5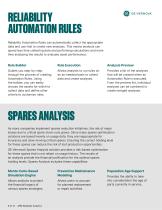
RELIABILITY AUTOMATION RULES Reliability Automation Rules can automatically collect the appropriate data and use that to create new analyses. This means analysts can spend less time collecting data and performing calculations and more time analyzing the results to evaluate asset performance. Rule Builder Rule Execution Analysis Preview Guides you step-by-step through the process of creating Automation Rules. Using the builder, you can easily choose the assets for which to collect data and define other criteria to customize rules. Allows analysts to run rules on an as-needed basis to collect data...
Open the catalog to page 6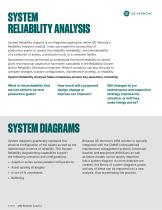
System Reliability Analysis is an integrated application within GE Vernova's Reliability Analytics module. It lets you model the connectivity of production assets to assess the reliability, availability, and maintainability of a collection of assets, a production unit, or a complete facility. Simulations can be performed to understand the future reliability of assets given the historical values that have been calculated in the Reliability Growth and/or Reliability Distribution analyses. What-if scenarios can also be used to compare changes in asset configurations, maintenance strategy, or reliability....
Open the catalog to page 7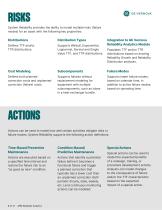
RISKS System Reliability provides the ability to model multiple risks (failure modes) for an asset with the following key properties: Distribution Types Integration to GE Vernova Reliability Analytics Module Defines TTF and/or TTR distributions. Supports Weibull, Exponential, Lognormal, Normal and Single Value TTF, and TTR distributions. Cost Modeling Failure Modes Defines both planned correction costs and unplanned correction (failure) costs. Supports failures without replacement modeling for equipment with multiple subcomponents, such as tubes in a heat exchanger bundle. Supports latent failure...
Open the catalog to page 8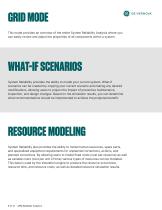
GRID MODE This mode provides an overview of the entire System Reliability Analysis where you can easily review and adjust the properties of all components within a system. WHAT-IF SCENARIOS System Reliability provides the ability to model your current system. What-if scenarios can be created by copying your current scenario and making any desired modifications, allowing users to project the impact of preventive maintenance, inspection, and design changes. Based on the simulation results, you can determine what recommendations should be implemented to achieve the projected benefit. RESOURCE MODELING...
Open the catalog to page 9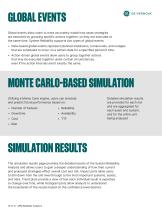
GLOBAL EVENTS Global events allow users to more accurately model how asset strategies are executed by grouping specific actions together, so they are executed at the same time. System Reliability supports two types of global events: • Date-based global events represent planned shutdowns, turnarounds, and outages that are scheduled to occur on a certain date for a specified period of time. • Action-driven global events allow users to group together actions that may be executed together under certain circumstances, even if the action intervals aren't exactly the same. Detailed simulation results...
Open the catalog to page 10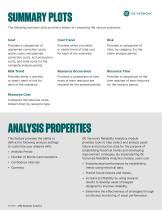
SUMMARY PLOTS The following summary plots provide a means of comparing the various scenarios: Provides a comparison of unplanned correction costs, action costs, and planned correction costs, lost production costs, and total costs for the complete analysis period. Provides either a monthly or yearly trend of risk for each of the scenarios. Provides either a monthly or yearly trend of total cost for each of the scenarios. Provides a comparison of how many of each resource are required for the analysis period. Provides a comparison of risks, by category, for the entire analysis period. Provides...
Open the catalog to page 11All General Electric catalogs and technical brochures
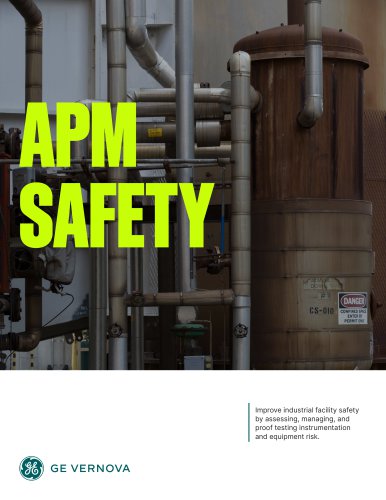 APM SAFETY
9 Pages
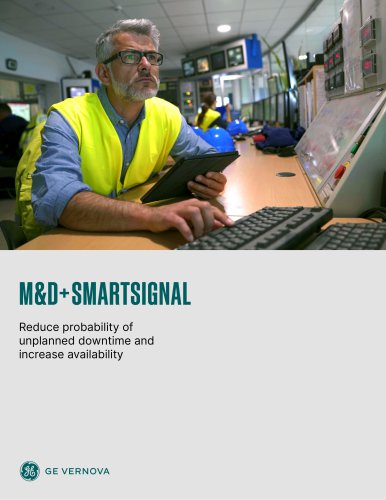 M&D+SMARTSIGNAL
7 Pages

Archived catalogs
 Grid
Grid2 Pages
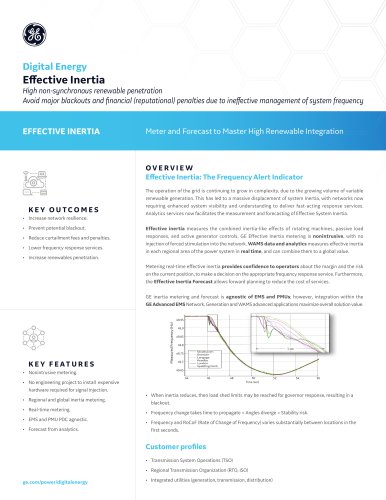 inertia
2 Pages
 iFix
iFix3 Pages
 cimplicity
3 Pages
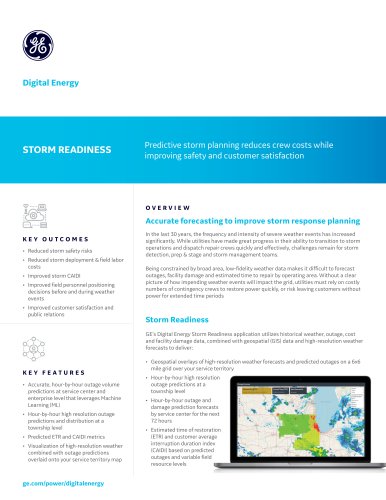 storm
storm2 Pages
- Nora management software
- Automation software solution
- Nora analysis software
- Process software
- Real-time software
- Computer-aided design software
- Cloud-based software
- Control software
- Design software solution
- Monitoring software solution
- Nora industrial software
- Interface software
- Measurement software
- Quality software
- Visualization software solution
- Simulation software solution
- Automated software
- Programming software
- Development software
- Network software