- Catalogs
- Format Messtechnik GmbH
- New Methods of Analysis for Foam Rise Data
New Methods of Analysis for Foam Rise Data
1 /1Page

New Methods of Analysis for Foam Rise Data
1 /1Page
Catalog excerpts
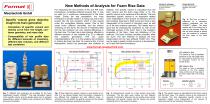
New Methods of Analysis for Foam Rise Data Specific volume gives objective insight into foam generation - Calculation of specific volume and density curve from rise height, container geometry, and mass data - Comparability of rise profile data for different amounts of chemistry, different test volumes, and different test containers For measuring the rise process of PU and PIR foam formulations, contactless distance sensors (Fig. 1) may be used for a continuous measurement of the foam height. During the test preparation, the foam formulation is usually mixed in a mixing cup and is then poured into the test container which is then placed under the contactless distance sensor. Due to fast cream times, different viscosities, and the mixture remaining on the stirrer, the amount of chemistry filled into the test container can vary causing differences in the foam rise. The foam rise is also strongly affected by different amounts of raw material (Fig. 2) or different test container geometries. This can cause misinterpretations (Fig. 3) in the analysis and problems in sharing the foam rise data. To overcome this, Format Messtechnik GmbH has developed new methods of analysis. The specific volume is calculated from the foam volume and the foam mass (Figs. 4, 5). The specific volume is the reciprocal of the density. The time dependant specific volume is an expansion related curve independent of the amount of chemistry and the test container dimensions. Both curves are more or less independent of the amount of chemistry used, as well as of the test container geometry. This makes them a good tool for analyzing the expansion as well as the shrinkage process of the foam. Due to the insulation properties of the foam, there are limitations of the methods. The foam volumes, therefore shouldn’t differ too much. The new methods of analysis are both implemented into the new software FOAM V4.0. They can be used in quality control as well as in development of PU and PIR foam formulations. ERLAND E. HOFMANN Format Messtechnik GmbH D-76187 Karlsruhe Germany FRANK BERTUZZI Eurotech Distributors Inc. Northfield, Ohio 44067 USA Fig. 5: The loss of mass is measured by a laboratory balance integrated into the ® FOAMAT system. The foam residue left in the mixing cup is used for this purpose. After the test the foam sample is placed onto the balance to measure the final mass of the foam sample. www.format-messtechnik.com low density flexible foam high density shoe foam V(t): volume vs. time The volume vs. time is calculated according to the rise height data, the test container dimensions and an estimation function for the sample shape. rise height specific volume 5.6 1200 corrected by mass and test container dimensions specific volume specific volume / density corrected by mass and test container dimensions rise height rise profile rise profile 32 400 specific volume / density Fig. 1: Different test containers are available for the Foam ® Qualification System FOAMAT . The new calculation method of the specific volume and the density allows one to compare measurement results of different test containers and different amounts of chemistry. M(t): mass vs. time The mass vs. time is calculated according to the final sample mass and the loss of mass data of the foam residue left in the mixing cup. Fig. 3: Measurement results of a high density shoe foam formulation. The two tests were carried out with different amounts of chemistry. Whereas the rise profile shows strong differences, the specific volume and the density are similar, indicating that it is the same formulation. Fig. 2: Rise height (H), specific volume (v) and density (ρ) vs. time of a low density flexible foam formulation, measured in two different test containers and with different mass. In contrast to the rise profile, the specific volume and the density show that the expansion properties are similar. specific volume: Fig. 4: The specific volume is calculated from the foam volume and the foam mass. The specific volume is the reciprocal of the density. The time dependant specific volume is an expansion related curve independent of the amount of chemistry and the test container dimen
Open the catalog to page 1All Format Messtechnik GmbH catalogs and technical brochures
 Format Testing Equipment
16 Pages


- Test machine
- Measuring device
- Material test machine
- Automated testing machine
- Computer-controlled test machine
- Compression testing machine
- Industrial testing machine
- Laboratory testing machine
- Automatic test kit
- Digital gauge
- Precision testing machine
- Research and development testing machine
- Manual test equipment
- Electromechanical testing machine
- Plastic testing machine
- Quality control testing machine
- Industrial test kit
- Rubber testing machine
- Digital testing machine