Group: Emerson

Catalog excerpts
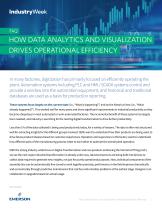
HOW DATA ANALYTICS AND VISUALIZATION DRIVES OPERATIONAL EFFICIENCY In many factories, digitization has primarily focused on efficiently operating the plant. Automation systems including PLC and HMI / SCADA systems control and provide a window into the automation equipment, and historical and traditional databases are used as a basis for production reporting. These systems focus largely on the current state (i.e., “What is happening?”) and on the historical view (i.e., “What already happened?”). This worked well for many years and drove significant improvements in industrial productivity as they became ubiquitous in most automated or semi-automated factories. The incremental benefit of these systems has largely been realized, and industry is searching for the next big digital transformation to drive further productivity. Less than 1% of the data collected is being used productively today, for a variety of reasons. The data is often not structured well for extracting insights for the different groups involved. OEMs want to understand how their products are being used, to drive future product releases based on customer experiences. Operators and supervisors in the factory want to understand how different parts of the manufacturing process relate to each other to optimize the overall plant operation. With the strong industry-wide focus on Digital Transformation and new products embracing the Internet of Things (IoT), we see the next major industrial transformation is already under way. Advanced sensors are being built into devices to collect data required to generate new insights, not just for purely operational purposes. Now, individual components of the assembly line can be automatically fine-tuned to work together precisely, performance in the field improves dramatically and economically through predictive maintenance that catches and remedies problems at the earliest stage. Designers can collaborate on upgrades based on actual usage. How Data Analytics and Visualization Drives Operational Efficien
Open the catalog to page 1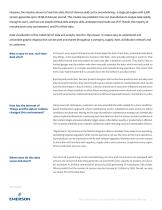
However, the massive amount of real-time data that IoT devices yield can be overwhelming—a single jet engine with 5,000 sensors generates up to 10 GB of data per second. This creates new problems: how can manufacturers analyze data rapidly enough to use it, and how can people without data analysis skills understand and make use of it? Overall, the majority of manufacturers only use between 1 and 5% of their data. Data visualization of the industrial IoT data and analytic results is the answer. It creates easy-to-understand and actionable graphic displays that can be used and shared...
Open the catalog to page 2
Much of this data isn’t structured, is cluttered and disorganized, or is siloed in different departments, so people who all need it can’t share access. Functional leaders lack complete access to data they need for critical decisions. They often must look to multiple sources that don’t always communicate with each other. Also, not everyone in your company who needs this data to do their job more efficiently and/or make better decisions has analytical skills to make sense of it. Perhaps most importantly, if data isn’t analyzed almost immediately, latency reduces its value—it becomes just...
Open the catalog to page 3All Emerson catalogs and technical brochures
-
 Industrial Power Supplies
12 Pages
-
 RXi Industrial Displays
7 Pages
-
 PACMotion VFD
8 Pages
-
 PACSystems RX3i I/O
8 Pages
-
 VersaPoint I/O
4 Pages
-
 CS803 and CS823
2 Pages
-
 PACMotion VFD
5 Pages
-
 VersaMax MicroMotion
4 Pages
-
 PACSystems RX3i CPL410
4 Pages


