


- Company
- Products
- Catalogs
- News & Trends
- Exhibitions
Brochure
Brochure
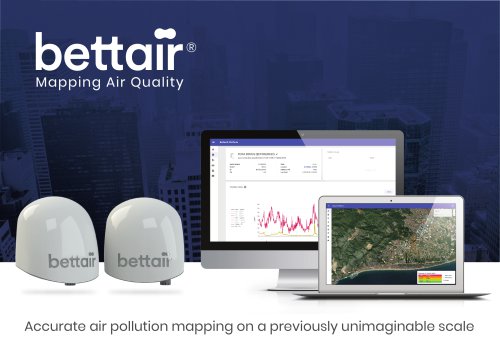
This document introduces a novel smart-city technology designed for large-scale air pollution mapping. It provides insights to help understand and mitigate noise and air pollution effectively.
Specifications
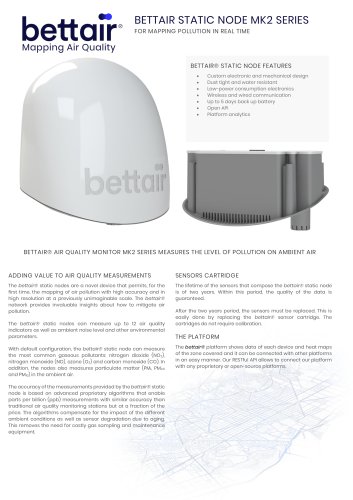
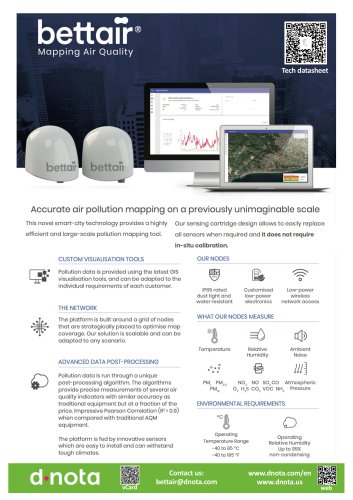
The platform uses a grid of strategically placed nodes to optimize map coverage. It features a sensing cartridge design that allows easy sensor replacement without in-situ calibration. The system is IP65 rated, ensuring it is dust-tight and water-resistant, and operates within a temperature range of -10 to 40 ºC and up to 95% non-condensing humidity.
Data Processing and Accuracy
Pollution data is processed through a unique algorithm, offering precise measurements comparable to traditional equipment but at a lower cost. The system demonstrates a high Pearson Correlation (R2 > 0.9) with traditional Air Quality Monitoring (AQM) equipment.
Environmental Measurements
The nodes measure various air quality indicators, including PM1, PM2.5, PM10, NO2, NO, SO2, CO, O3, H2S, CO2, VOC, NH3, temperature, ambient noise, and relative humidity.
Applications and Benefits
The technology aids in mitigating air pollution, identifying unknown pollution sources, generating revenue through fines, assessing environmental actions, reducing pollution costs, categorizing zones by air quality, forecasting pollution episodes, and monitoring climate change.
Health Impacts of Pollution
Air pollution affects public health significantly, contributing to diseases affecting the central nervous system, liver, spleen, blood, heart, respiratory system, and reproductive system.
Technical Infrastructure
The platform includes a back-end, front-end, and mobile apps, with components like an Air Quality IoT Agent, Authorisation PDP, Identity Manager, Context Broker, Data Models, and Data Processor.
Measurement Specifications
The document provides detailed measurement specifications for various pollutants, including their range, limit of detection, resolution, precision, and units.
Conclusion
This technology offers a scalable, adaptable solution for air quality mapping, contributing to better city management and improved public health.
Catalog excerpts
bettairbettcm Accurate air pollution mapping on a previously unimaginable scale
Open the catalog to page 1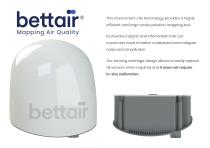
This novel smart-city technology provides a highly efficient and large-scale pollution mapping tool. It provides insights and information that our customers need to better understand and mitigate noise and air pollution. Our sensing cartridge design allows to easily replace all sensors when required and it does not require in-situ calibration.
Open the catalog to page 2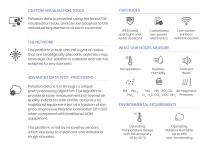
CUSTOM VISUALISATION TOOLS Pollution data is provided using the latest GIS visualisation tools, and can be adapted to the individual requirements of each customer. IP65 rated dust tight and water resistant Customised Low-power low-power wireless electronics network access The platform is built around a grid of nodes that are strategically placed to optimise map coverage. Our solution is scalable and can be adapted to any scenario. WHAT OUR NODES MEASURE ADVANCED DATA POST-PROCESSING Pollution data is run through a unique post-processing algorithm. The algorithms provide precise measurements of...
Open the catalog to page 3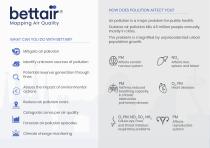
® Mapping Air Quality WHAT CAN YOU DO WITH BETTAIR? HOW DOES POLLUTION AFFECT YOU? Air pollution is a major problem for public health. Outdoor air pollution kills 4.5 million people annually, mostly in cities. The problem is magnified by unprecedented urban population growth. Mitigate air pollution Identify unknown sources of pollution Affects central nervous system Affects liver, spleen, and blood Potential revenue generation through fines Assess the impact of environmental actions Reduce air pollution costs Categorize zones per air quality Forecast air pollution episodes Climate change monitoring...
Open the catalog to page 4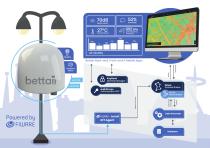
Bettair Back-end, Front-end & Mobile Apps Ambient Noise Identity Manager Context Broker Authorisation PDP Update Context Data Models Data Processor
Open the catalog to page 5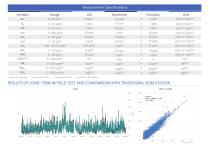
Measurement Specifications • Limit of Detection •• parts per million ••• parts per billion •••• Index for Air Quality
Open the catalog to page 6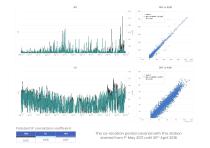
Pollutant R2 correlation coefficient NO2 The co-location period covered with this station started from 1st May 2017 until 30th April 2018
Open the catalog to page 7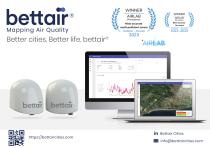
Best accuracy for ozone y# Outdoor - Overall ' “AIRLAB in Bettair Cities ^ info(a)bettaircities.com
Open the catalog to page 8All DNOTA catalogs and technical brochures
 Bettair air quality sensor
2 Pages
 Acreeditations
2 Pages
- Air quality sensor
- Temperature air quality sensor
- Relative humidity air quality sensor
- CO2 air quality sensor
- VOC air quality sensor
- Digital air quality sensor
- LoRaWAN air quality sensor
- PM2.5 air quality sensor
- PM10 air quality sensor
- IP65 air quality sensor
- Wireless air quality sensor
- Atmospheric pressure air quality sensor
- PM1 air quality sensor
- Real-time air quality sensor
- Outdoor air quality sensor
- Noise air quality sensor
- CO air quality sensor
- IoT air quality sensor
- NO2 air quality sensor
- NH3 air quality sensor