 Website:
CS Instruments GmbH & Co. KG
Catalog excerpts

Software CS Network Energy monitoring for compressed air and gases in an enterprise The CS Network is a client-server solution. The server software automatically collects the measured values of all chart recorders and sensors embedded in the company’s computer network and stores them in a database. The evaluation/ analysis of the measured data is carried out via the evaluation software (client) at any number of workstations. • Display real-time data in individual dashboards Automatic reporting for consumption: Weekly, monthly, annually Automatic alarm by e-mail if limit value is exceeded or not reached Alarm history Single sensors with Ethernet connection or chart recorders with several sensors measure the compressed air and gas consumption of all departments/cost centres in an enterprise. The CS Network (Server Installation) automatically collects the measured values of all CS chart recorders and CS sensors which are connected to the computer network in an enterprise and stores them in a database. The evaluation/analysis of the measured data is carried out via the evaluation software (Client) at an unlimited number of workstations. In case of an exceeding of the limit values (freely adjustable), there will be an automatic alarm via e-mail
Open the catalog to page 1
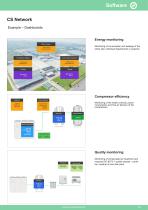
Software CS Network Example – Dashboards Energy monitoring Monitoring of consumption and leakage of the entire site, individual departments or systems Compressor efficiency Monitoring of the intake controls, power consumption and free air delivery of the compressors Quality monitoring Monitoring of compressed air treatment and required ISO 8573-1 quality classes – particles, residual oil and dew point
Open the catalog to page 2
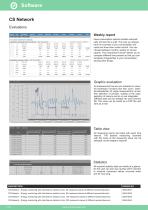
Software CS Network Evaluations Weekly report Have consumption reports created automatically and sent by e-mail. This way you always have an overview of your consumption and costs and have them under control. You can choose between monthly, weekly or annual reports. The comparison function allows you to compare different time periods so that you can recognise irregularities in your consumption, among other things.. Graphic evaluation All measurement curves are indicated in colour. All necessary functions like free zoom, selection/deselection of single measurement curves, free selection of...
Open the catalog to page 3All CS Instruments GmbH & Co. KG catalogs and technical brochures
-
Data sheet FA 510
1 Pages
-
Data sheet - IAC 500 - EN
1 Pages
-
Data sheet - PTS 500 - EN
1 Pages
-
Data sheet - PC 400 mobile
6 Pages
-
UltraCam LD 500/510
7 Pages
-
Data sheet - VA 570 - EN
5 Pages
-
Data sheet DS 52 Set - EN
1 Pages
-
Data sheet - VA 550 - EN
4 Pages
-
Data sheet - VD 500 - EN
2 Pages
-
Data sheet - DS 500 - EN
4 Pages
-
Data sheet - VX 570 - EN
4 Pages
-
Data sheet - DS 400 - EN
4 Pages
-
Data sheet - VU 570 - EN
3 Pages
-
Data sheet - VA 521 - EN
2 Pages
-
Data sheet - VA 525 - EN
2 Pages
-
Data sheet FA 550 - EN
2 Pages
-
Data sheet - VA 520
4 Pages
-
Data sheet - PI 500
2 Pages
-
Data sheet - DS 400 Set
2 Pages
-
Data sheet FA 500
2 Pages
-
Data sheet - VA 500
2 Pages
-
Data sheet LD 450
2 Pages
-
Data sheet - OILCHECK mobile
6 Pages
-
Data sheet LD 500
8 Pages
-
Data sheet FA 515 Ex
1 Pages
-
Data sheet LD 400
2 Pages
-
Data sheet LD 500
4 Pages
-
Data sheet DP 500
4 Pages
-
Data sheet FA 510
2 Pages
-
Data sheet - VA 570
12 Pages
-
Data sheet - DS 400 mobile
8 Pages
-
Data sheet - DS 500
10 Pages
-
Data sheet - PC 400 mobile
6 Pages
-
Data sheet - DS 500 mobile
8 Pages
-
Data sheet DP 400 mobile
2 Pages
-
Data sheet - PI 500
7 Pages
-
Data sheet - VA 500/520
9 Pages


