- Catalogs
- ColorLite GmbH
- ColorLite PC Software
ColorLite PC Software
1 /17Pages

ColorLite PC Software
1 /17Pages
Catalog excerpts
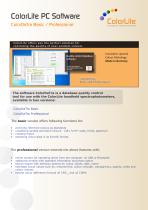
ColorLite PC Software ColorDaTra Basic / Professional Innovative Farbmesstechnik ColorLite offers you the perfect solution for controling the quality of your product colours Quality control database software Innovative spectral Colour Metrology Made in Germany Try the new range of spectrophotometers from ColorLite. ColorDaTra Basic and Professional The software ColorDaTra is a database quality control tool for use with the ColorLite handheld spectrophotometers, available in two versions: ColorDaTra Basic ColorDaTra Professional The basic version offers following functions for: • • • • archiving reference colours as standards visualising sample and batch colours - CIE L*a*b* scale, trend, spectrum creating report exporting colour data in an Excel© format. The professional version extends the above features with: • • • • online window for operating direct from the computer via USB or Bluetooth additional window with standard information and photo option search engine with selection options for colour values, date, name extended colour values such as; metamerism, colour strength, transparency, opacity, white and yellow indicies • extend colour difference formula DE CMC
Open the catalog to page 1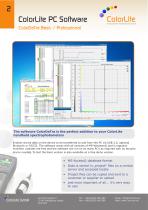
ColorDaTra Basic / Professional Innovative Farbmesstechnik Colour Data Report Sn>nd*rd deviation | ColorDaTra Professional -- C:\UseisVUimirastrator\De5kWp\Exarnplejjroject .rndb Fjlc S-rttidgj Dsta Project Sp*tlio photo-meter Search E^lra s Quality Chetl Spectrum | Table | Trend | CE-acy CE-lVo' j Onhli | The software ColorDaTra is the perfect addition to your ColorLite handheld spectrophotometers 'Enables stored data on the device to be transferred to and from the PC via USB 2.0, optional Bluetooth or RS232. The software works with all versions of MS-Windows© and is regularly modified. Updates...
Open the catalog to page 2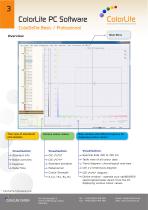
ColorDaTra Basic / Professional Innovative Farbmesstechnik File Settings Data Project Spectrophotometer Search Extra 5 Quality Check Report User War □E-xy C-IE-L^aT | Online Tree view of standards Various colour values Main window with different options for displaying colour values 1 Standard info Batch overview Pass/ Fail Standard deviation Colour Strength Table view of all colour data Trend diagram: chronological overview Online window - operate your sph860/900 spectrophotometer direct from the PC displaying various colour values ColorDaTra Professional only ColorLite GmbH Email: [email protected]...
Open the catalog to page 3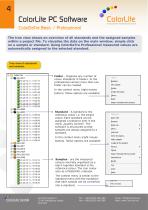
ColorLite PC Software ColorLire Innovative Farbmesstechnik ColorDaTra Basic / Professional The tree view shows an overview of all standards and the assigned samples within a project file. To visualise the data on the main window, simple click on a sample or standard. Using ColorDaTra Professional measured values are automatically assigned to the selected standard. Tree view of standards -° Folder - Organise any number of colour standards in folders. In the professional version more than one In the context menu (right mouse button) follow options are available: reference colour i.e. the target...
Open the catalog to page 4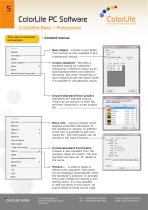
ColorDaTra Basic / Professional Innovative Farbmesstechnik Tree view of standards - Context menus Create standard - Import standard from project More info _ Make sample Create St from batch _ Import standard from project -o New object - Creates a new folder. This function is only available in the Professional version.- Create standard - Normally a standard should be created by measuring a reference colour as all imprecise. But when comparing co- lours measured with the same model it is possible to use absolute values. Import standard from project Standards are digitised colours. These can be...
Open the catalog to page 5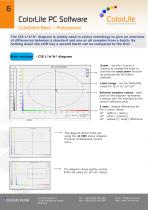
ColorDaTra Basic / Professional Innovative Farbmesstechnik The CIE L*a*b* diagram is widely used in colour metrology to give an overview of differences between a standard and one or all samples from a batch. By holding down the shift key a second batch can be compared to the first. Main window - CIE L*a*b* diagram Shsv all samples from buttons to change the scale or activate the auto zoom function Limit range - set the PASS/FAIL Relative samples values - each point on the diagram represents a sample with the standard as the central reference point 3 axes - display differences for Ab* yellow(+)...
Open the catalog to page 6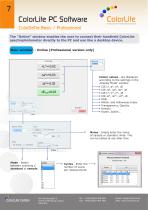
ColorDaTra Basic / Professional Innovative Farbmesstechnik The "Online" window enables the user to connect their handheld ColorLite spectrophotometer directly to the PC and use like a desktop device. ain window - Online (Professional version only) Current value I Save I H Autn save Save name: o Sample Standard N □ rjAuto Spectrum Table | rend | C Display Made Save ] FT] Auto save Save name: Mode - Select brate ^^^^H Colour values - are displayed „Display Mode" window: -o White- and Yellowness Index Name - simply enter the name of sample or standard. Note: This can be edited at any later time...
Open the catalog to page 7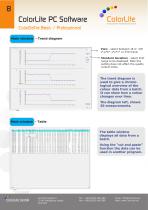
Innovative Farbmesstechnik ColorDaTra Basic / Professional Main window - Trend diagram View - select between DE or CIE L*,a*b*, L*u*v* or XYZ trend. Standard deviation - select limit range to be displayed. Note this setting does not affect the quality control limits. The trend diagram is used to give a chronological overview of the colour data from a batch. It can show how a colour changes over time. The diagram left, shows 20 measurements. Main window - Table The table window displays all data from a batch. Using the “cut and paste” function the data can be used in another program. ColorLite...
Open the catalog to page 8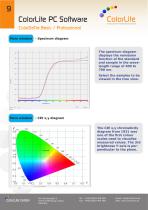
Innovative Farbmesstechnik ColorDaTra Basic / Professional Main window - Spectrum diagram The spectrum diagram displays the remission function of the standard and sample in the wavelength range of 400 to 700 nm. Select the samples to be viewed in the tree view. Main window - CIE x,y diagram The CIE x,y chromaticity diagram from 1931 was one of the first colour scales used to visualise measured values. The 3rd brightness Y-axis is perpendicular to the plane. ColorLite GmbH Am Zimmerplatz 2 37191 Katlenburg-Lindau Germany Email: [email protected] Web: www.ColorLite.de
Open the catalog to page 9All ColorLite GmbH catalogs and technical brochures
 ColorLite Densitometer sd350
4 Pages
 ColorDaTra IPM - Overview
7 Pages
 sph900 und sph870
32 Pages
 Industry spectrophotometer sph9i
12 Pages
 ColorLite ColorCube
2 Pages
 ColorLite sph xs1
2 Pages
 ColorLite sph870
2 Pages
 ColorLite sph860
2 Pages
 ColorLite MA38 and MA38-Set
2 Pages
 ColorLite MA35-UK
2 Pages
 ColorLite sph900
32 Pages
 Spectrophometer
2 Pages
 Laboratory Spectrophotomter
2 Pages


