
- Catalogs
- Bruker Daltonics
- Rapid Analysis of Complex Mixtures Using the solariX-CM, FTMS Platform


Rapid Analysis of Complex Mixtures Using the solariX-CM, FTMS Platform

Rapid Analysis of Complex Mixtures Using the solariX-CM, FTMS Platform
Catalog excerpts
Bruker Daltonics Technical Note # TN-34 Rapid Analysis of Complex Mixtures Using the solariX-CM, FTMS Platform Abstract The solariX-CM FTMS represents the ultimate MS solution for addressing complex mixtures that are not easily amenable to chromatographic separation techniques. These application areas include, but are not limited to, petroleomics (e.g. crude oil analysis), environmental analysis (e.g. humic acid analysis in river waters), and metabolomics. The resolving power required for dealing with the inherent and extreme complexity of these applications is typically greater than 400,000. Mass accuracies in the sub-ppm range are also essential to help ensure reliable molecular formulae assignments. The solariX-CM routinely delivers ultimate selectivity and specificity with “benchtop” ease-of-use. Introduction Mass spectrometry, in combination with chromatographic separation methods, has been widely used to address the challenges associated with complex mixtures. However, the development and optimization of chromatographic separation methods for complex mixtures can be laborious and increases the overall analysis time. Moreover, some compound classes and mixtures are simply not amenable to standard separation techniques such as high pressure liquid chromatography (HPLC) or capillary electrophoresis (CE). The unparalleled resolving power of the solariX-CM Fourier transform mass spectrometer (FTMS) reduces the demands on chromatographic separation methods thereby making complex mixture analysis much more efficient. The classification of the components in crude oil including the speciation of heteroatomic compounds like sulfur or nitrogen compounds with specific double bond equivalents are necessary for crude oil analysis on the molecular level. Leveraging the resolution and mass accuracy of the FTMS, the elemental composition of individual compounds of crude oil has been analyzed [1] – [5]. Since the compound classes in oil represent a range of polarity and gas-phase basicity it is essential to analyze each sample under both positive and negative modes and with different atmospheric pressure ionization (API) techniques. An advantage of the solariX is quick change-over (in less than 5 minutes!) between API sources, such as electrospray (ESI), atmospheric pressure chemical ionization (APCI) and atmospheric pressure photo ionization (APPI). Complex, rich datasets are quickly analyzed using Composer™ from Sierra Analytics. Composer is a comprehensive software package that is specific to petroleomics data. It quickly and accurately provides classification and DBE
Open the catalog to page 1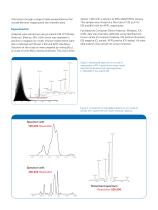
diluted 1:100 with a solution of 50% MeOH/50% toluene. This sample was infused at a flow rate of 120 μL/h for ESI and @ 6 ml/h for APPI, respectively. information through a range of data representations that include Kendrick mapping and Van Krevelen plots. Facilitated by Composer (Sierra Analytics, Modesto, CA, USA), data was internally calibrated using identified and known series of compound classes: ESI positive (N series), ESI negative (O2 series), APPI positive (CH series). All other data analysis was carried out using Composer. Analyses were carried out using a solariX-CM 12T (Bruker Daltonics,...
Open the catalog to page 2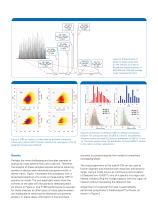
Figure 3: Enhancement of dynamic range using CASI for the analysis of crude oil. Broadband resolving power of 950,000 with 100 ppb average mass measurement error. Figure 4: DBE vs. carbon number plots for different compound classes of crude oil (APPI Positive, radical ions), average error for all assigned compounds is 85 ppb Results Perhaps the most challenging and complex samples to analyze by mass spectrometry are crude oils. Therefore, the analysis of these samples requires extreme resolving powers to discern each elemental component within a dense matrix. Figure 1 illustrates this complexity...
Open the catalog to page 3
The DBE plots in Figure 6 show different distributions, demonstrating the need for different ionization sources to achieve complete analysis of the heteroatom fraction of crude oil samples. Composer is used to comprehensively analyze the data from oil samples. Loading peak lists into Composer is straightforward and facile. From the main user interface one can easily generate different plots ranging from DBE vs. carbon number, Kendrick- and van Krevelen-plots. For example, Figure 4 displays DBE vs. carbon number-plots for different compound classes. Another example of the output from the data...
Open the catalog to page 4All Bruker Daltonics catalogs and technical brochures
 DE-tector flex
8 Pages
 MATRIX II-MG
8 Pages
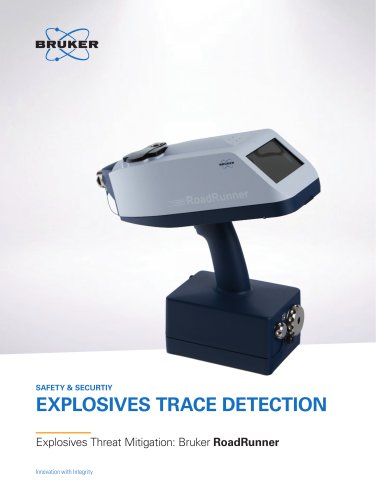 RoadRunner
8 Pages
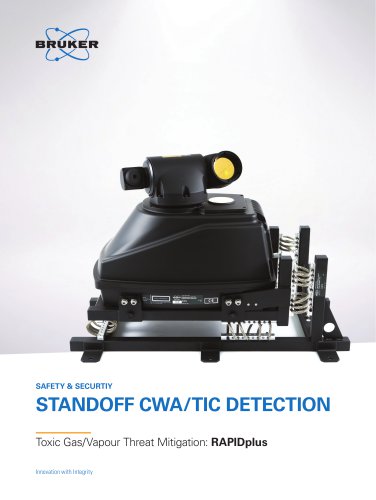 RAPIDplus
12 Pages
 RAID-XP
8 Pages
 Maritime Detection Systems
7 Pages
 SVGps
SVGps4 Pages
 TIMON
TIMON13 Pages
 MALDI Biotyper® CA System
12 Pages
 RAID-M Series
7 Pages
 HDX Solution
2 Pages
 EVOQ GC-TQ
8 Pages
 timsTOF PRO
8 Pages
 Agri Solutions brochure
8 Pages
 PesticideScreener
8 Pages
 Elute LC series
8 Pages
 nanoElute®
6 Pages
 timsTOF™
8 Pages
 rapifleX™
8 Pages
 amaZon SL
6 Pages
 compact
8 Pages
 MALDI Biotyper
56 Pages
 rapifleX™ MALDI Tissuetyper™
8 Pages
 MALDI PharmaPulse™
4 Pages
 Toxtyper
6 Pages
 impact II
12 Pages
 maxis II
12 Pages
 amaZon speed
10 Pages
 Albira Brochure
12 Pages
 prime
prime12 Pages
 solarix
10 Pages
 Metabolomics
12 Pages
 aurora M90
10 Pages
 Clean Room Pack
4 Pages
 MATRIX-F FT-NIR Spectrometer
2 Pages
 TANGO
TANGO12 Pages
 The new autoflex? series
10 Pages
 MM 2
MM 26 Pages
 µRAID
µRAID4 Pages
 Radiation Backpack Sentry
4 Pages
 Posterbook Metabolomics ebook
14 Pages
 CaptiveSpray nanoBooster
8 Pages
 Scion SQ Series GC-MS
8 Pages
 solariX XR
12 Pages
 aurora Elite
6 Pages
 nano-Advance UHPLC
8 Pages
 EVOQ
EVOQ12 Pages
 CaptiveSpray
4 Pages
 ImagePrep
4 Pages
 micrOTOF-Q II
12 Pages
 PROTEINEER fc II
4 Pages
 Ultraflextreme
16 Pages
 Autoflix speed
10 Pages
 microflex
6 Pages
 SCION 436-GC
4 Pages
 SCION 456-GC
4 Pages
 GC CARE
8 Pages


Archived catalogs
 Brochure BioTools 2.2
10 Pages
 Brochure EASY-nLC
6 Pages
 Brochure micrOTOF II
8 Pages
 RAID-M 100
6 Pages
 compact?
6 Pages
 MALDI Biotyper
12 Pages
 Toxtyper
8 Pages
 micrOTOF-Q III
6 Pages
 impact HD
12 Pages
 Brochure MetaboliteTools 1.1
8 Pages
 Brochure ProfileAnalysis
4 Pages


- Automation software solution
- Bruker analysis software
- Process software
- Real-time software
- Microscope
- Control software
- Gas detector
- Monitoring software solution
- Optical microscope
- 3D software solution
- Industrial software
- Measurement software
- Interface software
- Visualization software solution
- Laboratory microscope
- Quality software
- Automated software
- Bruker industrial detector
- Monitoring detector