- Catalogs
- BlueSens gas sensor GmbH
- REPORT 1
REPORT 1

REPORT 1
The document provides an overview of BlueSens gas sensors GmbH's operations and their application in biotechnological processes. It highlights the company's commitment to providing reliable sensor technology for gas monitoring and process optimization in bioreactors, emphasizing the global reach and reliability of their products.
BlueSens sensors are designed for continuous gas analysis in biotechnological processes, offering detailed specifications and calibration processes to ensure high-quality measurements. The sensors are cost-effective and integrate production and research to optimize productivity.
- Off Gas Analyser in Bioengineering Education: Used at FH Campus Wien for fermentation labs, enhancing students' understanding of biotechnological applications.
- Continuous Bio-Ethanol Production: Monitored at Technical University Dortmund to optimize yield by maintaining ethanol concentrations below inhibitory levels.
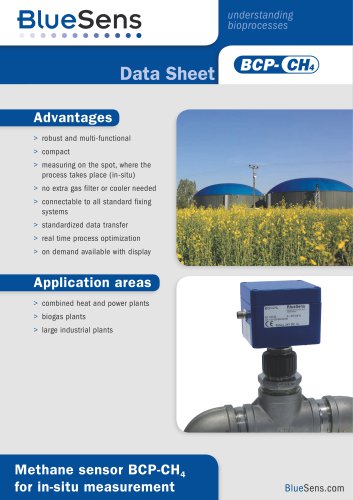
- Biogas Plant Optimization: Model-based techniques enhance efficiency and output.
- Oxygen and Carbon Dioxide Monitoring: Used to characterize oxygen transfer capacity in bioprocesses.
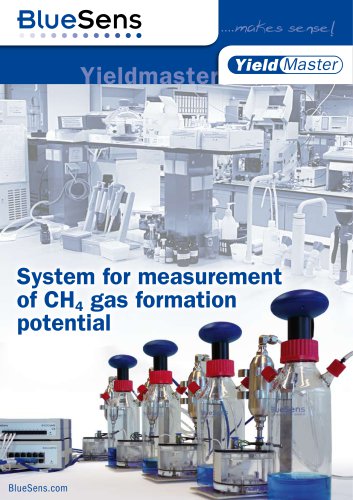
BlueSens offers a range of sensors and software solutions like BCpreFerm, YieldMaster, FermVis, and BACVis, designed to help users optimize their processes with precise measurements and system integration.
Sensors monitor gases like CO2, ethanol, and oxygen in bioreactors, allowing for online ethanol concentration determination without interference from other media components.
Research aims to develop a process model for predicting biogas plant behavior, showing good agreement with experimental data.
Details the use of a bioreactor for producing chemokines and potential malaria vaccines, with sensors monitoring gas balance values.
Optimizes preculture conditions to ensure cells are in exponential growth, with sensors providing noiseless signals.
Allows parallel experiments with independent process parameter control, optimizing recombinant protein production.
Includes a bioreactor equipped with BlueSens sensors for CO2 and ethanol, calibrated to specific initial volume fractions.
Experiments determine response times and process conditions, with specific growth rates and final cell concentrations detailed.
Finds a strong negative correlation between glucose uptake rate and TCA cycle operation rate, with recommendations for improved response times.
Illustrates fermentation course, showing CO2 and ethanol concentrations, biomass, and other metabolites.
Suggests using smaller measuring chambers for improved response times and maintaining appropriate gas flow rates.
Focuses on the comparison of Oxygen Uptake Rate (OUR) and Carbon Dioxide Production Rate (CPR) reactions to glutamine feed rate pulses in fermentation processes.
- Sensor Performance: Provides reliable data for OUR and CPR without significant time delays.
- Technical Specifications: Details specifications of BlueSens sensors, designed for robust performance.
- Installation and Connectivity: Offers versatile installation options and connectivity to process control systems.
- Software and Data Analysis: Provides tools for process visualization and data recording, enhancing process optimization.
- Advantages of In-Situ Measurement: Emphasizes benefits of real-time data collection, reducing contamination risk.
BlueSens sensors are presented as a reliable and efficient solution for gas analysis in bioprocessing, offering flexibility and ease of integration into various biotechnical plants.
Catalog excerpts

BlueSens Report No. 1, October 2010 © 2010 by BlueSens gas sensors GmbH, Herten, Germany, www.BlueSens.com This report was worked out in co-operation with APZ Ruhr-Lippe, www.apz-rl.de Page layout and cover design: Marcus Riepe, Krefeld, Germany, [email protected] Printing press: Offset Company, Wuppertal, Germany, www.offset-company.de
Open the catalog to page 2
Introduction BlueSens.com BlueSens Report No. 1 3 You may wonder why we have published a report with detailed product information and user data only recently after almost 10 successful years and several thousand sensors already sold? The answer is quite simple – time. It is only recently we have increased the human resources in our PR-department and in addition we have received the support of the APZ (center for applications Biotechnik Ruhr-Lippe) which has made it possible for us to publish now. Almost every new customer wanted this type of information however until recently we referred them...
Open the catalog to page 3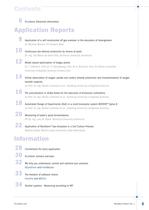
Contents BlueSens.com BlueSens Report No. 1 5 6 BlueSens. Advanced information 8 Application of a self constructed off gas analyser in the education of bioengineers Dr. Michael Maurer, FH Campus Wien 10 Continuous bio-ethanol production by means of yeast Dr.-Ing. Eva Maria del Amor Villa, Technical University Dortmund 12 Model based optimization of biogas plants Dr. F. Uhlenhut, Prof. Dr. S. Steinigeweg, Prof. Dr. A. Borchert, Prof. Dr. Reiner Lohmüller, University of Applied Sciences Emden/Leer 14 Online observation of oxygen uptake and carbon dioxide production and characterisation of oxygen...
Open the catalog to page 5
For controlling biotechnological processes you primarily depend on continuous information. BlueSens has made it to its business to provide this information for every customer by means of gas analysis directly in the process. Reliable measurement engineering makes the results available in highest measurement density and in real time. So biotechnological processes can be analyzed better and, as a result, of course also optimized. With this report we also want to give you advanced information. Numerous examples of applications show exactly how the products of BlueSens are used under real conditions....
Open the catalog to page 6
During the calibration process each sensor is tested and set up particularly. This process can take up to one week. It involves a lot of time, but it‘s worth it. In the detailed test procedure BlueSens solely uses certified test gases. Depending on the gas component to be measured, 10 to 18 different test gases are used. So it is assured that the sensors provide best results for each application the customer requires. Each sensor so becomes a handmade piece and is individually tested by BlueSens. BlueSens stands for sensors which are as uncomplicated as possible and therefore as competitive as...
Open the catalog to page 7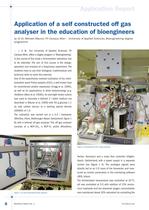
Application Report 8 BlueSens Report No. 1 BlueSens.com Our University of Applied Sciences, FH Campus Wien, offers a degree program in ‘Bioengineering’. In the course of this study a fermentation laboratory has to be attended. The aim of this course is the design, operation and analysis of a bioprocess experiment. The students have to use their biological, mathematical and technical skills to solve this exercise. One of the experiments involved cultivation of the methylotrophic yeast Pichia pastoris (X33); a well known host for recombinant protein expression (Cregg et al. 2000), as well as for...
Open the catalog to page 8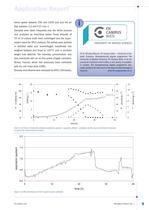
Application Report BlueSens.com BlueSens Report No. 1 9 stirrer speed between 250 and 1200 rpm and the air flow between 2.0 and 5.0 l min-1. Samples were taken frequently over the whole process and analysed as described below. Three aliquots of 10 ml of culture broth were centrifuged and the supernatant saved for HPLC analysis. The pellets were washed in distilled water and recentrifuged, transferred into weighed beakers and dried at 105°C until a constant weight was attained. The biomass concentration was also monitored with an on-line probe (Fogale nanotech, Nimes, France), which had previously...
Open the catalog to page 9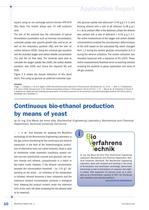
Application Report 10 BlueSens Report No. 1 BlueSens.com Japan) using an ion exchange column Aminex HPX-87H (Bio Rad). The mobile phase was 15 mM sulphuric acid. The aim of the exercise was the calculation of typical fermentation parameters such as biomass concentration, substrate uptake rate, specific growth rate, and so on, as well as the respiratory quotient (RQ) and the over all carbon balance (OCB). Using the universal gas equation and the recorded oxygen and carbon dioxide concentration [%] and the air flow data. The students were able to calculate the oxygen uptake rate (OUR), the carbon...
Open the catalog to page 10
Application Report BlueSens.com BlueSens Report No. 1 11 The continuous bio-ethanol production by means of in sodium alginate entrapped Saccharomyces cerevisiae (ATCC 7752) was successfully carried out at 40°C in a stirred bioreactor with an operating volume of 600 ml by continuous substrate feed over a period of five days. The sensors were connected gastight, allowing quantitative online records on gases (carbon dioxide, ethanol and oxygen) present in the headspace of the bioreactor (see figure 1). By using a suitable calibrated ethanol sensor a direct calculation of the ethanol content in the...
Open the catalog to page 11
Application Report 12 BlueSens Report No. 1 BlueSens.com Motivation Increasing amount of energy derived from biogas plants will only be available if a wide variety of different substrates can be used. The feed to a biogas reactor will change according to the fluctuating supply demand scenario for various substrates. The plant has to deliver maximum gas yield and hence energy yield for various substrates. This can only be achieved if the process parameters are optimized continuously. The model should be able to predict optimized process parameters as well as energy yield for a given substrate...
Open the catalog to page 12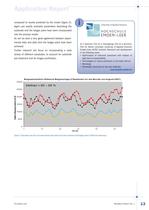
Application Report BlueSens.com BlueSens Report No. 1 13 compared to results predicted by the model (figure 2). Again just readily available parameters describing the substrate and the biogas plant have been incorporated into the process model. As can be seen a very good agreement between experimental data and data from the biogas plant have been achieved. Further research will focus on incorporating a wide variety of different substrates, to account for substrate pre-treatment and for biogas purification. Dr. F. Uhlenhut, Prof. Dr. S. Steinigeweg, Prof. Dr. A. Borchert, Prof. Dr. Reiner Lohmüller,...
Open the catalog to page 13All BlueSens gas sensor GmbH catalogs and technical brochures
 BCpreFerm
5 Pages
 BlueVIS 4.0
2 Pages
 YeastForce
4 Pages
 BlueInOne
12 Pages
Archived catalogs
 H2 sensor BCP-H2
2 Pages
 Brochure BlueInOne series
12 Pages
 Brochure BCP-CO2 sensor
8 Pages
 Data sheet BCP-O2
2 Pages
 BlueVary
2 Pages
 Data sheet BCpreFerm
8 Pages
 BlueSens Brochure
6 Pages
 Data Sheet BenchOne Biogas
2 Pages
 BlueSens Report No.3
19 Pages
 Brochure BlueSens 2012
6 Pages


- Gas analyzer
- Automation software solution
- Concentration analyzer
- Monitoring analyzer
- Process software
- Windows software
- Control software
- Benchtop analyser
- Process analyzer
- Monitoring software solution
- Continuous analyzer
- Real-time analyzer
- Integration analyzer
- Oxygen analyzer
- Compact analyzer
- Infrared analyser
- Temperature analyzer
- In-line analyzer
- Sampling analyzer