
- Catalogs
- BANALYTICS sp. z o.o.
- Banalytics Industrial Sensing Dashboards

Banalytics Industrial Sensing Dashboards
1 /2Pages
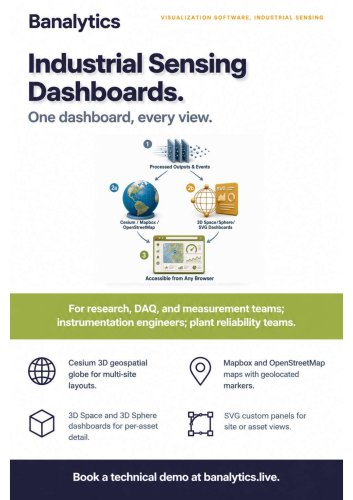
Banalytics Industrial Sensing Dashboards
1 /2Pages
Catalog excerpts
Banalytics VISUALIZATION SOFTWARE. INDUSTRIAL SENSING For research. DAQ, and measurement teams; instrumentation engineers; plant reliability teams. Mapbox and OpenStreetMap maps with geolocated markers. SVG custom panels for site or asset views.
Open the catalog to page 1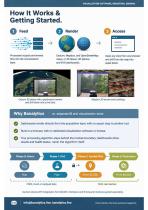
VISUALIZATION SOFTWARE, INDUSTRIAL SENSING Processed outputs and events flow into the orchestration layer. Open any view from any browser and drill from the map into asset detail. Cesium, Mapbox, and OpenStreetMap maps, or 3D Space, 3D Sphere, and SVG dashboards. Why BanalytiCS vs. separate Bl and visualization tools Dashboards render directly from the acquisition layer, with no export step to another tool. Runs in a browser, with no dedicated visualization software or license. Your processing algorithm stays behind the module boundary; dashboards show results and health status, never the algorithm...
Open the catalog to page 2All BANALYTICS sp. z o.o. catalogs and technical brochures
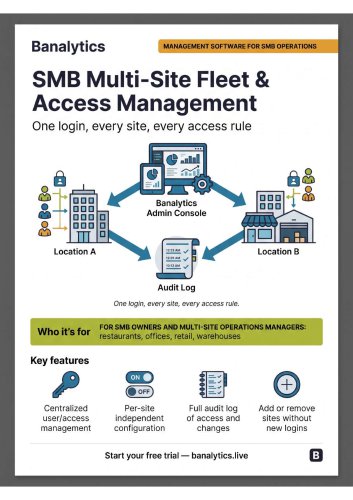
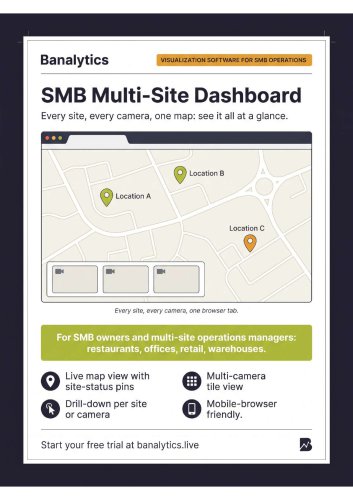
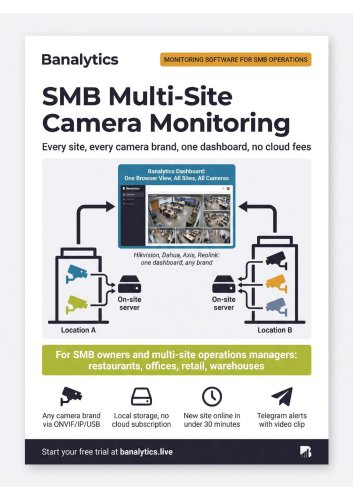
- Management software solution
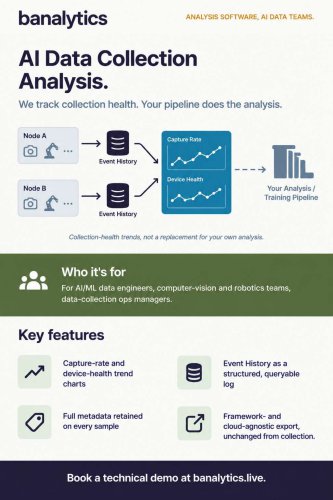
- Analysis software solution
- Real-time software
- Windows software
- Cloud-based software
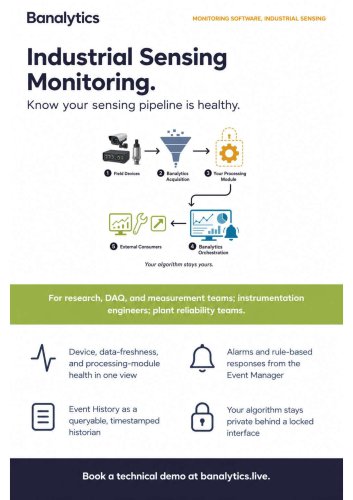
- Monitoring software solution
- Industrial software
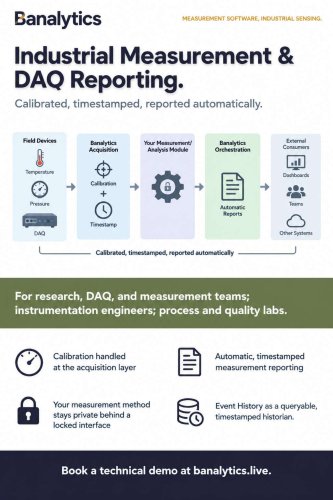
- Measurement software
- Automated software
- Reporting software
- EDM software
- Machine software
- Data acquisition software
- Centralized software
- Data collection software solution
- Calibration software
- Laboratory software
- Linux software
- Acquisition software