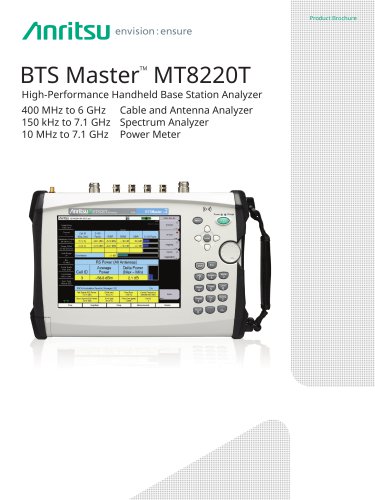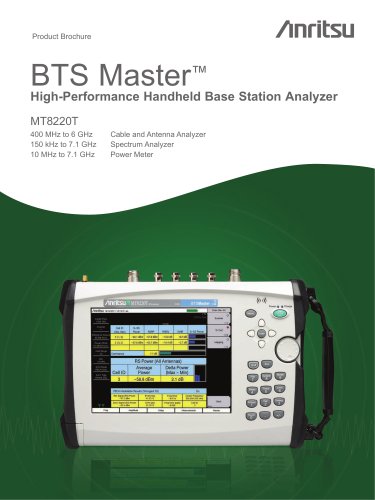
Catalog excerpts
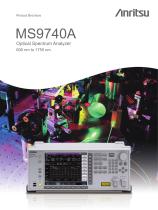
Product Brochure MS9740A Optical Spectrum Analyzer 600 nm to 1750 nm
Open the catalog to page 1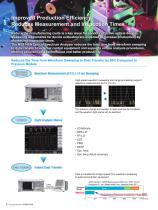
m^m\ ) Spectrum Measurement at 0.2 s / 5 nm Sweeping [®m vfcsmbi) I nstart Ma Tramsfar High-speed waveform sweeping and range processing support The spectrum change and variation in noise level can be monitored and the waveform light source can be switched. Data is transferred at high speed from waveform sweeping to external controller equipment. GPIB Interface, SMSR Measurement (DFB-LD), VBW=10 kHz, Resolution 0.1 nm, Sweep width 5 nm, Sampling Point 501 Analysis Transfer Me^surerwent itimes a_r,e.slashed b,yi a hjgfp 86%
Open the catalog to page 2
Ideal Solution for Active Optical Device Evaluation Supports Eight Application Modes This all-in-one unit has the performance and functions for evaluating all active optical devices, including SFP, XFP, and SFP+ modules, as well as optical transceivers and VCSEL and DFB optical sources. Evaluation results, such as center wavelength, level, spectrum, SMSR, OSNR, etc., are displayed on one screen. Combination with a Bit Error Rate Tester (BERT) supports spectrum analysis of optical transceiver outputs and WDM signals. ● Wavelength sweep time <0.2 s B ● uilt-in application for optical active...
Open the catalog to page 3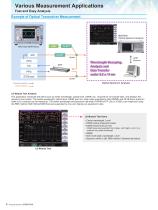
Various Measurement Applications Fast and Easy Analysis Example of Optical Transceiver Measurement LD Module Test Analysis This application measures test items such as center wavelength, optical level, OSNR, etc., required for LD module tests, and displays the results on one screen. The center wavelength, optical level, OSNR (per nm), side mode suppression ratio (SMSR) and 20 dB down spectrum width of LD modules can be measured. The center wavelength and spectrum half-width (FWHM) of FP-LDs or VCSELs are measured using the RMS method. Both SM and MM fibers are supported by one unit, helping...
Open the catalog to page 4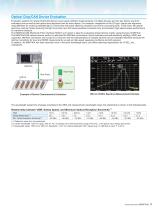
Optical Chip/CAN Device Evaluation Evaluation systems for optical Chip/CAN devices must support efficient measurements of multiple devices and two key factors are short evaluation time as well as fast optical axis alignment time for each device. For example, irrespective of the LD type, optical axis alignment using MM fiber for receiving radiated light in a short time with good efficiency requires a lot of time consuming work. In this case, the optical spectrum analyzer finally receiving this light must also have the lowest possible connection loss and excellent high-speed sweep performance...
Open the catalog to page 5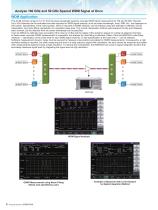
Analyze 100 GHz and 50 GHz Spaced WDM Signal at Once WDM Application The 42 dB dynamic range at 0.2 nm from the peak wavelength supports accurate WDM signal measurement at 100 and 50-GHz intervals. Up to 300 channels can be evaluated and data required for WDM signal analysis, such as center wavelength, level, SNR, etc., are displayed on one screen. Specification of the noise location, which is required at OSNR analysis, can be selected using two estimation methods; 2-point interpolation, and noise fitting interpolation of a specified noise area. The 2-point interpolation method...
Open the catalog to page 6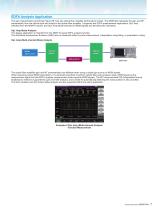
EDFA Analysis Application The gain characteristics and Noise Figure (NF) are key optical fiber amplifier performance indices. The MS9740A calculates the gain and NF automatically from the optical input and output to the optical fiber amplifier. It supports two EDFA measurement applications: Opt. Amp inherited from the MS9710 series; and Opt. Amp (Multi-channel) for WDM signals and the latest IEC standards. Opt. Amp Mode Analysis This legacy application is inherited from the MS9710 series EDFA analysis function. The Amplitude Spontaneous Emission (ASE) level is measured either by pulse...
Open the catalog to page 7
Easy Reference Measurement of Optical Filters using Waveform Difference Display Example of Narrow-band Filter Measurement Narrow-band Filter Analysis using Trace Mode Evaluation of passive devices, such as FBG, AWG, OBPF, etc., uses a wideband light source. The variance between results with and without (reference measurement) the DUT is measured to evaluate the DUT characteristics. The MS9740A has a large waveform memory for saving up to 10 waveforms and a wavelength difference calculation function making it easy to evaluate devices such as optical switches. Evaluation of passive device...
Open the catalog to page 8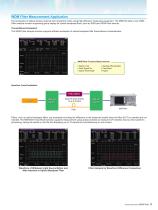
WDM Filter Measurement Application Fast evaluation of optical devices requires short inspection times using high-efficiency measuring equipment. The MS9740 adds a new WDM Filter analysis function supporting group display for optical bandpass filters, such as WSS and WDM Filter devices. Transmittance Evaluation The WDM Filter analysis function supports efficient evaluation of optical bandpass filter transmittance characteristics. WDM Filter Function Measurements ● Signal Level ● Peak Signal No. ● Signal Wavelength ● Spacing (Wavelength) ● Pass Band ● Ripple Insertion Loss Evaluation Filters,...
Open the catalog to page 9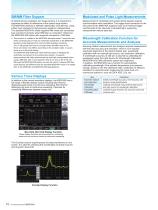
SM/MM Fiber Support Modulated and Pulse Light Measurements At optical device evaluation and measurement, it is important to suppress the effect of reflections at the optical input section. The MS9740A achieves a reflection attenuation of 35 dB max. using a fiber input structure for high-accuracy spectrum measurement. The standard MS9740A model supports MM mode and connection loss correction functions when MM fiber is connected*. Moreover, the MS9740A-009 option also supports connection of SM fiber. Measurement of modulated and pulsed optical signals requires synchronization with modulation....
Open the catalog to page 10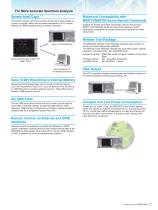
For More Accurate Spectrum Analysis Screen Hard Copy The built-in screen hard copy function dumps the screen image as a bmp or png file, which can be easily transferred to a PC via the Ethernet or GPIB interface using a remote command. Backward Compatibility with MS9710/MS9780 Series Remote Commands Support for almost all remote commands used by the previous MS9710 and MS9780 series of instruments assures smooth backwards compatibility and easy future-proof migration to newer instruments. Remote Tool Package The MS9740A Remote Tools Package supports easy creation of remote command sequences...
Open the catalog to page 11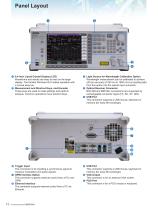
Panel Layout 8.4-inch Liquid Crystal Display (LCD) Waveforms and results are easy to read on the large display. The familiar Windows GUI makes operation with a mouse easy too. Measurement and Shortcut Keys, and Encoder These keys are used to make settings and perform analysis. Common operations have shortcut keys. Trigger Input This connector is for inputting a synchronous signal to measure modulation and pulse signals. GPIB Interface Option This connector supports external control from a PC over GPIB. Ethernet Interface This connector supports external control from a PC via Ethernet. Light...
Open the catalog to page 12All Anritsu catalogs and technical brochures
-
Electronic measuring instruments
24 Pages
-
MW90010A Coherent OTDR
8 Pages
-
OTA Product Catalog
20 Pages
-
BERTWave™MP2100B
24 Pages
-
Network Master™ Series
36 Pages
-
PIM Master™ MW82119B
2 Pages
-
MT8821C
20 Pages
-
PIM over CPRI Measurement
2 Pages
-
C-RAN Solutions
8 Pages
-
Site Master™ S331P
19 Pages
-
MG3710A Vector Signal Generator
36 Pages
-
Spectrum Master MS2712E/13E
32 Pages
-
MG3740A Analog Signal Generator
24 Pages
-
MD8475A Signalling Tester
28 Pages
-
Spectrum Master MS2720T
24 Pages
-
LMR Master S412E
2 Pages
-
VNA Master MS20xxB
16 Pages
-
Site Master S3xxE
20 Pages
-
VectorStar MS4640B Series VNA
32 Pages
-
PIM Master MW82119A
8 Pages
Archived catalogs
-
BTS Master MT8220T_2019
40 Pages
-
BTS Master MT8220T_2013
28 Pages
-
MD8430A Product Introduction
24 Pages
-
Signalling Tester
2 Pages
-
Optical Devices Product Guide
10 Pages
-
Analyzers catalogue
655 Pages


