


Easy basics of vibration diagnostics. Beginner’s guide.
Easy basics of vibration diagnostics. Beginner’s guide.
Vibration diagnostics is essential for preventing machine failures and reducing maintenance costs by measuring vibration values to assess machine conditions.
Historical Context of Maintenance Management
Maintenance evolved from reactive to preventive and finally to predictive, focusing on regular condition monitoring for efficiency.
Measurement Process
Involves using a vibration analyzer, sensor, and software for regular data collection, with online systems recommended for critical machines.
Evaluation of Measurement Values
Standards like ISO 20816 provide vibration limits. In their absence, comparisons and trend analysis are used. Regular monitoring is crucial.
Understanding Vibration Signals
Key parameters include amplitude and velocity. Digitization allows for detailed analysis of machine conditions.
Conclusion
Vibration diagnostics is vital for detecting faults and planning maintenance effectively.
Peak value measures the amplitude of a time signal, crucial for vibration analysis.
Sampling Frequency
Regular sampling allows for detailed mathematical analysis of vibrations.
Average Value (AVG)
Calculated by averaging sample values, with specific conversions for sine functions.
RMS Value
Measures vibration magnitude, indicating energy in the signal.
Frequency
Crucial for diagnostics, as different faults manifest at different frequencies.
Vibration Sensor
Converts vibrations into electrical signals for analysis.
SI Units
Ensures consistency in measurements.
Displacement and Velocity Measurement
Measured in meters and mm/s or inch/s, respectively, with velocity indicating changes in displacement.
Focuses on displacement, velocity, and acceleration, explaining their relevance to machine vibrations.
Velocity and Acceleration
Describes changes in velocity and displacement, with acceleration influenced by forces.
Phase and Period
Uses angular values to describe waveform shifts.
Vibration Diagnostics
Emphasizes simple, quick measurements and the importance of specifying parameters.
Types of Sensors and Mounting
Acceleration sensors are common, with proper mounting crucial for accuracy.
Measurement Directions
Explains radial and axial directions, recommending sensor placement near bearings.
Speed Measurement
Uses a tacho probe to calculate speed.
Initial Measurements and Faults
Focus on overall RMS values, with specific faults measured in velocity or acceleration.
Evaluation and Standards
Values are evaluated against standards like ISO 20816, with suggested limits for bearings.
Focuses on higher frequencies to monitor machine health, using comparisons to identify anomalies.
Trend Analysis and Limits
Stable values suggest normal operation, with warning and danger limits set for rising values.
Impact of Speed on Measurements
Speed affects measurements, requiring speed data alongside vibration data.
Diagnostic Tools
Simple instruments provide reliable diagnostics, with specific frequency ranges for velocity and acceleration.
Resonance and Critical Speed
Occurs at certain speeds, often due to poor design, requiring frame alterations.
Electrical Unbalance
Detected by observing vibration during motor shutdown.
Measurement Practices
Structured routines and regular intervals ensure timely data collection.
Reporting and Evaluation
Focus on machines needing attention, with internal diagnostics preferred.
Calibration
Ensures measurement accuracy, mainly for quality audits.
Analyzes vibrations using time signals and frequency spectrums to identify component conditions.
Mechanical Fault Detection
Identifies faults through frequency spectrum analysis, with harmonics indicating misalignment or looseness.
Advanced Diagnostics of Rolling Bearings
Uses demodulation to detect bearing wear, highlighting significant peaks in the spectrum.
Listening to Vibrations and Ultrasound
Traditional methods are limited, with ultrasound offering no significant advantage over sensors.
Recalculations of Acceleration, Velocity, and Displacement
Provides formulas for conversions, emphasizing frequency importance.
Online Measurements
Offers continuous monitoring advantages over portable analyzers.
Balancing
Facilitates rotor balancing, with single-plane balancing described.
Guides on rotor balancing using Adash instruments, referencing ISO 1940 for standards.
Balancing Procedures
Describes one or two-plane balancing, recommending controlled environment testing.
Measurement Parameters
- Sensor Settings: Includes power settings and sensitivity.
- Overall Measurement Settings: Covers channel selection and filter settings.
- Time Signal Measurement: Discusses sampling frequency adjustments.
- Spectrum Measurement: Utilizes FFT for conversion, with specific settings.
- Demod Spectrum Measurement: Focuses on envelope analysis for bearing faults.
Conclusion
Encourages continuous learning and improvement in measurement skills.
Contact Information
ADASH spol. s r. o., Ostrava, Czech Republic. Phone: +420 596 232 670, Email: [email protected], Website: www.adash.com
Catalog excerpts

Easy basics of vibration diagnostics. Beginner’s guide. Radek Sglunda Adéla Štefková Radim Lang
Open the catalog to page 1
- RMS - Root Mean Square
Open the catalog to page 2
There‘s nothing to be afraid of If you are faced with the task of implementing and performing vibration diagnostics in your company, then do not panic. This area offers both simple and complex procedures and methods. You will start with the simplest ones and gradually work your way up to more complex ones. At the beginning, you will perform measurements very similar to those made with a voltmeter. Only you will not measure voltage, current or resistance, but vibration values. The basic task of diagnostics is to prevent unexpected failures, because eliminating their consequences entails high costs....
Open the catalog to page 5
But what methods can be used to measure the condition of the machine? Vibration diagnostics has an absolutely dominant role in measuring the condition of the machine. It can accurately measure the severity of all basic machine failures. In the following chapters, we will explain everything that is needed for its use. We will not go into theoretical details and mathematical formulas. This is not necessary for the successful implementation of vibration measurements and the subsequent evaluation of the machine condition. In the past, acceptable vibration was tested by putting a coin on a machine....
Open the catalog to page 6
intervention as soon as possible. Exceeding the danger limit means the machine must be shut down immediately and repaired. The basic standard is ISO 20816. What if there are no standards? Then other procedures are needed. If we have several identical or similar machines, then we can compare the values between them. If the vibrations on five of six identical machines have a value of 2 and on the sixth the value is 8, then there is clearly something wrong with the sixth machine. Another option is to analyze the trend of the development of vibration values. If the trend is stable over the long time,...
Open the catalog to page 7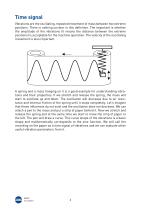
Time signal Vibrations are the oscillating, repeated movement of mass between two extreme positions. There is nothing unclear in this definition. The important is whether the amplitude of the vibrations (it means the distance between the extreme positions) is acceptable for the machine operation. The velocity of the oscillating movement is also important. A spring and a mass hanging on it is a good example for understanding vibrations and their properties. If we stretch and release the spring, the mass will start to oscillate up and down. The oscillation will decrease due to air resistance and...
Open the catalog to page 8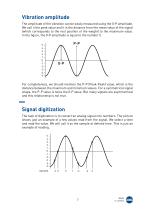
Vibration amplitude The amplitude of the vibration can be easily measured using the 0-P amplitude. We call it the peak value and it is the distance from the mean value of the signal (which corresponds to the rest position of the weight) to the maximum value. In the figure, the 0-P amplitude is equal to the number 5. For completeness, we should mention the P-P (Peak-Peak) value, which is the distance between the maximum and minimum values. For a symmetrical signal shape, the P-P value is twice the 0-P value. But many signals are asymmetrical and this relationship is not true. Signal digitization...
Open the catalog to page 9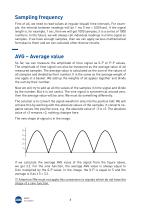
Sampling frequency First of all, we need to read values at regular (equal) time intervals. For example, the interval between readings will be 1 ms (1ms = 0.001sec). If the signal length is, for example, 1 sec, then we will get 1000 samples, it is a series of 1000 numbers. In the future, we will always call individual readings in a time signal as samples. If we have enough samples, then we can apply various mathematical formulas to them and we can calculate other diverse results. AVG – Average value So far, we can measure the amplitude of time signal as 0-P or P-P values. The amplitude of time...
Open the catalog to page 10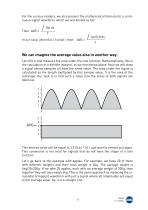
For the curious readers, we also present the mathematical formula for a continuous signal waveform, which we will denote as f(x). T In our case, when f(x) = Ι sin(x) Ι then We can imagine the average value also in another way. Let‘s fill in and measure the area under the sine function. Mathematically, this is the calculation of a definite integral, as we mentioned above. Now we will draw a signal whose samples all have the same value. The area under the signal is calculated as the length multiplied by this sample value. It is the area of the rectangle. Our task is to find such a value that the...
Open the catalog to page 11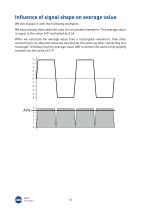
Influence of signal shape on average value We will explain it with the following examples. We have already described the case of a sinusoidal waveform. The average value is equal to the value 0-P multiplied by 0.64. When we calculate the average value from a rectangular waveform, then after converting to an absolute value we see almost the same as after converting to a rectangle. It follows that the average value AVG is almost the same (only slightly smaller) as the value of 0-P. 5 4 3 2 1 0 -1 -2 -3 -4 -5
Open the catalog to page 12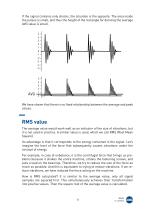
If the signal contains only shocks, the situation is the opposite. The area inside the pulses is small, and thus the height of the rectangle for deriving the average AVG value is small. 5 4 3 2 1 0 -1 -2 -3 -4 -5 We have shown that there is no fixed relationship between the average and peak values. RMS value The average value would work well as an indicator of the size of vibrations, but it is not used in practice. A similar value is used, which we call RMS (Root Mean Square). Its advantage is that it corresponds to the energy contained in the signal. Let‘s imagine the level of the force that...
Open the catalog to page 13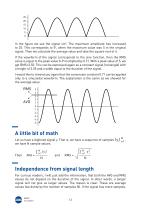
In the figure we see the signal sin2. The maximum amplitude has increased to 25. This corresponds to 52, when the maximum value was 5 in the original signal. Then we calculate the average value and take the square root of it. If the waveform of the signal corresponds to the sine function, then the RMS value is equal to the peak value 0-P multiplied by 0.71. With a peak value of 5, we get RMS=3.55. This can be expressed again as a constant signal (rectangle) with a height of 3.55 and a width equal to the duration of the signal. I would like to remind you again that the conversion constant 0.71...
Open the catalog to page 14All Adash catalogs and technical brochures
 Adash A4801v2 Sensor Simulator
2 Pages
 DDS
4 Pages
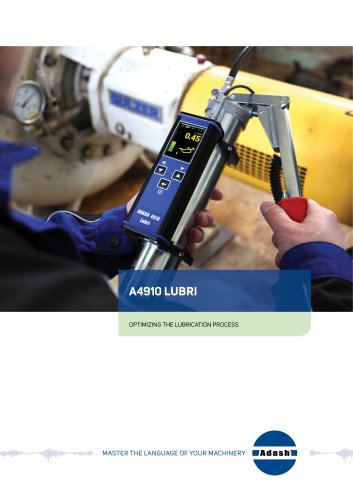 A4910 Lubri
4 Pages
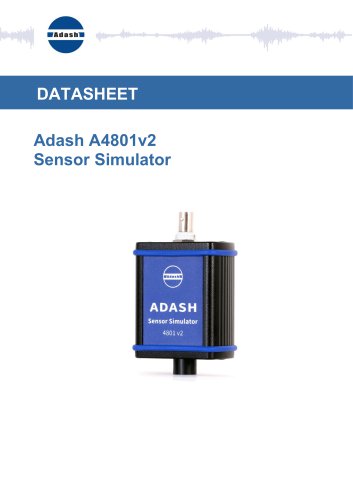 A4801 v2 Sensor Simulator
2 Pages
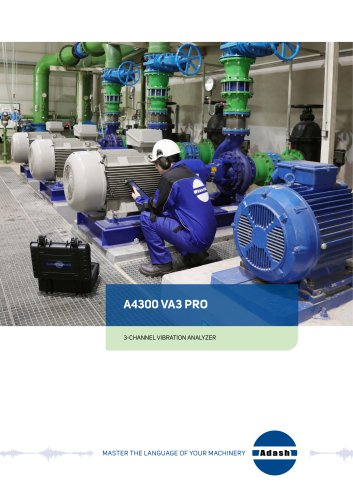 A4300 VA3 Pro
3 Pages
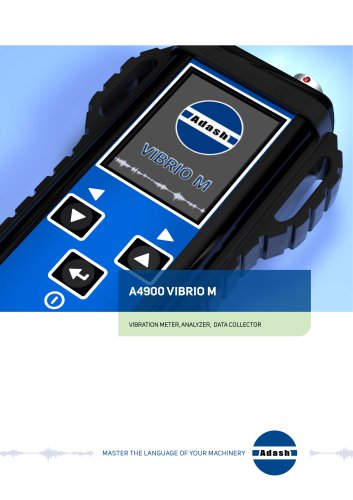 A4900 Vibrio M
3 Pages
 A4300 VA3 Pro Ex
4 Pages
 Adash Brochure
17 Pages
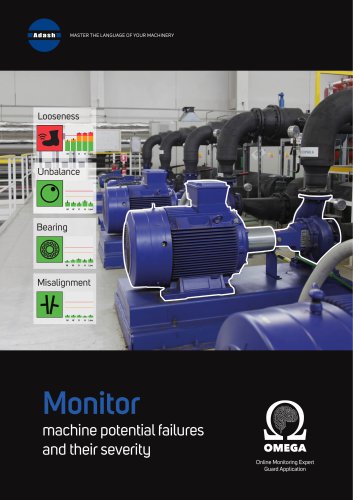 Omega_Data_sheet
4 Pages
 A4404 SAB
4 Pages
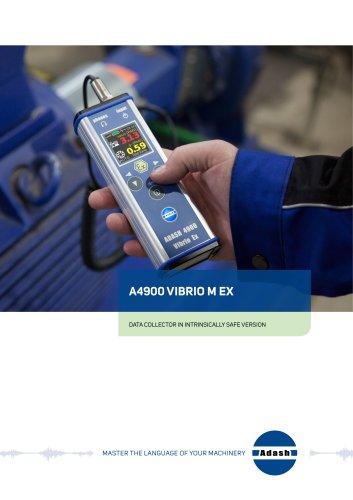 A4900 - Vibrio M Ex
4 Pages
 VA5 Pro
3 Pages
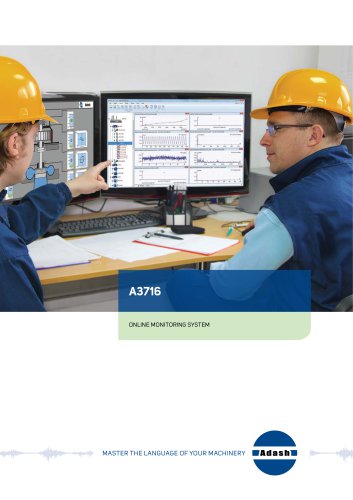 A3716
3 Pages
 A3800
4 Pages
Archived catalogs
 A4910 Lubri
4 Pages
 Omega_manual
32 Pages
- Analysis software solution
- Process software
- Cloud-based software
- Monitoring software solution
- Measurement software
- Machine software
- Condition monitoring module
- Digital monitoring module
- Storage software
- Adash vibration meter
- Online monitoring module
- Benchtop monitoring system
- Vibration monitoring device
- Alarm software
- Compact monitoring module
- Data acquisition monitoring module
- Machine monitoring module
- Mechanical software
- Adash portable vibration meter