
Catalog excerpts

Signal Processing Toolbox Perform signal processing, analysis, and algorithm development Signal Processing Toolbox™ provides industry-standard algorithms for analog and digital signal processing (DSP). You can use the toolbox to visualize signals in time and frequency domains, compute FFTs for spectral analysis, design FIR and IIR filters, and implement convolution, modulation, resampling, and other signal processing techniques. Algorithms in the toolbox can be used as a basis for developing custom algorithms for audio and speech processing, instrumentation, and baseband wireless communications. Signal Processing Toolbox is included in MATLAB and Simulink Student Version. Key Features ▪ Signal and linear system models ▪ Signal transforms, including fast Fourier transform (FFT), discrete Fourier transform (DFT), and short-time Fourier transform (STFT) ▪ Waveform and pulse generation functions, including sine, square, sawtooth, and Gaussian pulse ▪ Transition metrics, pulse metrics, and state-level estimation functions for bilevel waveforms ▪ Statistical signal measurements and data windowing functions ▪ Power spectral density estimation algorithms, including periodogram, Welch, and Yule-Walker ▪ Digital FIR and IIR filter design, analysis, and implementation methods ▪ Analog filter design methods, including Butterworth, Chebyshev, and Bessel ▪ Linear prediction and parametric time-series modeling
Open the catalog to page 1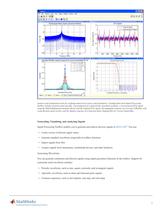
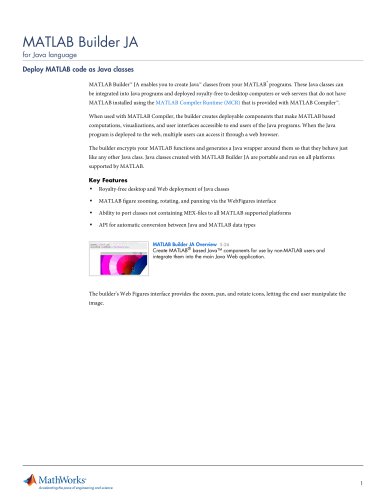
Fie Edit Analysis Insert Vttw Debug Desktop Window Hdp Periodogram Mean. Square Spectrum Estimate Figure 3 > ! Figure Magritude Response (dB) * | - Original Signal - Reconstructed Signal Sample index Figure 4: Magnitude Response (dB) Normaized Frequency (*s raiysimple; Analysis and visualization tools for verifying numerical accuracy and performance. Example plots from Signal Processing Toolbox include (clockwise from top left): A periodogram of a numerically controlled oscillator; a reconstructed ECG signal using the Walsh-Hadamard transform shown with the original ECG signal; the...
Open the catalog to page 2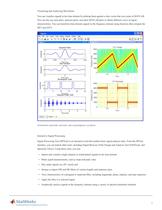
Visualizing and Analyzing Waveforms You can visualize signals in the time domain by plotting them against a time vector that you create in MATLAB. You can also use stem plots, staircase plots, and other MATLAB plots to obtain different views of signal characteristics. You can transform time-domain signals to the frequency domain using functions that compute the File Et*t View Insert Took Debug Desktop Wirnkm Help Gaussian Pulse Rectangular Train Gaussian Pulse Train Visualization ofperiodic, aperiodic, and swept-frequency waveforms. Interactive Signal Processing Signal Processing Tool...
Open the catalog to page 3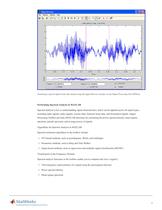
File Markers Window Help Visualizing a speech signal in the time domain using the Signal Browser interface in the Signal Processing Tool (SPTool). Performing Spectral Analysis in MATLAB Spectral analysis is key to understanding signal characteristics, and it can be applied across all signal types, including radar signals, audio signals, seismic data, financial stock data, and biomedical signals. Signal Processing Toolbox provides MATLAB functions for estimating the power spectral density, mean-square spectrum, pseudo spectrum, and average power of signals. Algorithms for Spectral Analysis...
Open the catalog to page 4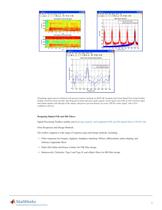
Visualizing signal spectra obtained with spectral analysis methods in MATLAB. Example plots from Signal Processing Toolbox include (clockwise from top left): Spectrogram of clean and noisy audio signals; mean-square spectrum of A/D converter input and output signals with aliasing in the output; and power spectral density of a noisy 200 Hz cosine signal, with a 95% confidence interval. Designing Digital FIR and IIR Filters Signal Processing Toolbox enables you to design, analyze, and implement FIR and IIR digital filters in MATLAB. Filter Responses and Design Methods The toolbox supports a...
Open the catalog to page 5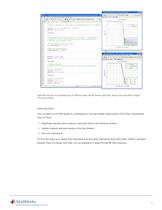
V Editor ■ t:\ProeramF I lesUAmABUUC 10b SGOnly^Ml&M'ilsM^BisdemosVfdesicnsettiriiiLtdflcJdoi EOVt Tort GO Cd To* Mug Dttfctop WmOw 4 Tb*M ar« *pocifi>3-d at 0«*ign UM a* * piT«Mt«T/v«in« pair- Tor «x*JNple; deal511 [Iir "elllp' H 'I-Li*cr.Ejtflctly ' r 'paastand ' J 4 jfceae parueterj c-tn alao be- apeci fi ed 111 a. jirnciare. .he CESl£itTOP*t!i 4 netJKxJ will return * valid ■ truetnre lor y&ur ofi^ect and ipse1r1cod 4 algorithm wii.li the default values 4 1*' r!.n .Iff-inn design tl» OptlOBa 4 Hatch tfte atoptmnd exactly. 4 Oeaign can alio lie Died ta inveitigitfl varion aetijijcl,...
Open the catalog to page 6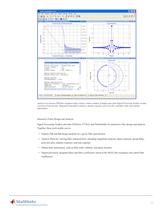
■> Filter Visualization Tool LIBM Fie Edit Analysis Insert VKH Debug Desktop Window Help l,lBgn<ude(tJS) and Phase Responses F1g.ure> 1: Magnitude [dB] and Phase Responses MormalisefJ Frequency (*E radisarrpte) Filter Structure Filter Length Linear Phase Design Method Ir.formation Design Algorithm : kaisejrwin Design Options ScslePessband : true Design. Specifleadens Sampling Frequency t M/A {rc-maliEed feci Response : Lowpass Impu Response Figure 3: PoleVZero Plot | Figure-2: Impulse Response x Figure 3: Pole/Zero plot x F.gu-e 4: FDter Information Analysis of a lowpass FIR filter designed...
Open the catalog to page 7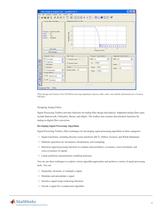
Filter Design & Analysis Tool - [untitled,fda *] File Edit Analysis Targets View Window Help ■ Cui rent Fitter Information ■■■ Source: Designed Store Filter.. Filter Manager.. -Response Type- -Design Method - @ Minimum order . Frequency Specifications - Fpass: I^SOQ -Magnitude Specifications - Designing Filter... Done Filter Design and Analysis Tool (FDATool) showing magnitude response, filter order, and stability information for a lowpass Designing Analog Filters Signal Processing Toolbox provides functions for analog filter design and analysis. Supported analog filter types include...
Open the catalog to page 8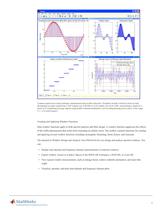
File B*t We^ Insect Tools Debug Desktop Winds* Help Resampling audio signal from 4SkHz (DAT rale) to 44.1kHz (CD sample rate Original Signal Interpolated Signal -Modulated Message Signal I Figure -t * | Figure 3 x Figure z x Figure 1 * Common signal processing techniques implemented using toolbox functions. Examples include (clockwise from top left): Resampling an audio signal from a DAT sample rate of 48 kHz to a CD sample rate of 44.1 kHz, interpolating a signal by a factor of 4, modulating message signals using double sideband modulation, and encoding floating-point scalars in the range...
Open the catalog to page 9All The MathWorks catalogs and technical brochures
-
 MATLAB Production Server
6 Pages
-
 Database Toolbox
4 Pages
-
 MATLAB Report Generator
4 Pages
-
 Stateflow
8 Pages
-
 SimEvents
7 Pages
-
 SimDriveline
7 Pages
-
 SimHydraulics
7 Pages
-
 SimPowerSystems
8 Pages
-
 Simulink Control Design
5 Pages
-
 Aerospace Blockset
5 Pages
-
 SimRF
SimRF6 Pages
-
 Simulink Coder
6 Pages
-
 Embedded Coder
8 Pages
-
 Simulink PLC Coder
4 Pages
-
 Fixed-Point Designer
9 Pages
-
 MATLAB Coder
5 Pages
-
 Simulink 3D Animation
10 Pages
-
 Gauges Blockset
2 Pages
-
 Simulink Report Generator
3 Pages
-
 Polyspace Bug Finder
6 Pages
-
 global-optimization-toolbox
10 Pages
-
 Phased Array System Toolbox
9 Pages
-
 OPC Toolbox
5 Pages
-
 Simulink Design Verifier
7 Pages
-
 Simulink Design Optimization
10 Pages
-
 Filter Design HDL Coder
5 Pages
-
 Bioinformatics Toolbox
9 Pages
-
 SimBiology
6 Pages
-
 Computer Vision System Toolbox
10 Pages
-
 DSP System Toolbox
11 Pages
-
 Fuzzy Logic Toolbox
5 Pages
-
 Polyspace Client for C/C++
5 Pages
-
 xPC Target
5 Pages
-
 SimMechanics
7 Pages
-
 Simscape
7 Pages
-
 Simulink
6 Pages
-
 Data Acquisition Toolbox
8 Pages
-
 Image Processing Toolbox
7 Pages
-
 Control System Toolbox
6 Pages
-
 Symbolic Math Toolbox?
6 Pages
-
 Parallel Computing Toolbox?
7 Pages
-
 MATLAB®
6 Pages
-
 Mapping Toolbox 3.2
7 Pages
-
 Instrument Control Toolbox
7 Pages
-
 Optimization Toolbox 6.0
14 Pages


Archived catalogs
-
 MATLAB Release Notes
505 Pages
-
 C and Fortran API Reference
263 Pages
-
 External Interfaces
649 Pages
-
 Function Reference: Volume 3 (P-Z)
1696 Pages
-
 Function Reference: Volume 2 (F-O)
1568 Pages
-
 Function Reference: Volume 1 (A-E)
1298 Pages
-
 Creating Graphical User Interfaces
520 Pages
-
 3-D Visualization
212 Pages
-
 Graphics
667 Pages
-
 MATLAB Programming Tips
66 Pages
-
 Programming Fundamentals
840 Pages
-
 Data Analysis
220 Pages
-
 Mathematics
316 Pages
-
 MATLAB® Getting Started Guide
250 Pages

