- Catalogs
- The MathWorks
- Optimization Toolbox 6.0
Optimization Toolbox 6.0
1 /14Pages

Optimization Toolbox 6.0
1 /14Pages
Catalog excerpts
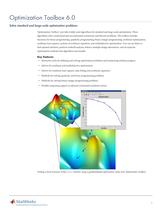
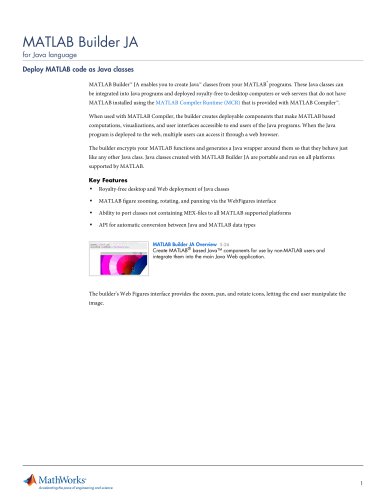
Optimization Toolbox 6.0 table.main {} tr.row {} td.cell {} div.block {} div.paragraph {} .font0 { font:5.00pt "Arial", sans-serif; } .font1 { font:7.00pt "Arial", sans-serif; } .font2 { font:9.00pt "Arial", sans-serif; } .font3 { font:10.00pt "Arial", sans-serif; } .font4 { font:20.00pt "Arial", sans-serif; } .font5 { font:7.00pt "Courier New", monospace; } .font6 { font:8.00pt "Times New Roman", serif; } .font7 { font:14.00pt "Times New Roman", serif; } Optimization Toolbox 6.0 Solve standard and large-scale optimization problems Optimization Toolbox provides widely used algorithms for standard and large-scale optimization. These algorithms solve constrained and unconstrained continuous and discrete problems. The toolbox includes functions for linear programming, quadratic programming, binary integer programming, nonlinear optimization, nonlinear least squares, systems of nonlinear equations, and multiobjective optimization. You can use them to find optimal solutions, perform tradeoff analyses, balance multiple design alternatives, and incorporate optimization methods into algorithms and models. Key Features ■ Interactive tools for defining and solving optimization problems and monitoring solution progress ■ Solvers for nonlinear and multiobjective optimization ■ Solvers for nonlinear least-squares, data fitting, and nonlinear equations ■ Methods for solving quadratic and linear programming problems ■ Methods for solving binary integer programming problems ■ Parallel computing support in selected constrained nonlinear solvers Finding a local minimum of the peaks function using a gradient-based optimization solver from Optimization Toolbox. MathWorks- Accelerating the pace of engineering and science
Open the catalog to page 1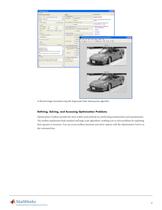
Optimization Toolbox 6.0 table.main {} tr.row {} td.cell {} div.block {} div.paragraph {} .font0 { font:5.00pt "Arial", sans-serif; } .font1 { font:7.00pt "Arial", sans-serif; } .font2 { font:9.00pt "Arial", sans-serif; } .font3 { font:8.00pt "Times New Roman", serif; } .font4 { font:14.00pt "Times New Roman", serif; } - - x 1 A blurred image recovered using the large-scale linear least-squares algorithm. Defining, Solving, and Assessing Optimization Problems Optimization Toolbox includes the most widely used methods for performing minimization and maximization. The toolbox implements both standard...
Open the catalog to page 2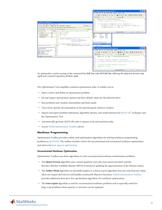
Optimization Toolbox 6.0 table.main {} tr.row {} td.cell {} div.block {} div.paragraph {} .font0 { font:5.00pt "Arial", sans-serif; } .font1 { font:7.00pt "Arial", sans-serif; } .font2 { font:8.00pt "Arial", sans-serif; } .font3 { font:9.00pt "Arial", sans-serif; } .font4 { font:8.00pt "Times New Roman", serif; } .font5 { font:15.00pt "Times New Roman", serif; } An optimization routine running at the command line (left) that calls MATLAB files defining the objective function (top right) and constraint equations (bottom right). The Optimization Tool simplifies common optimization tasks. It enables...
Open the catalog to page 3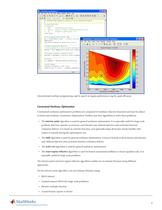
Optimization Toolbox 6.0 table.main {} tr.row {} td.cell {} div.block {} div.paragraph {} .font0 { font:5.00pt "Arial", sans-serif; } .font1 { font:7.00pt "Arial", sans-serif; } .font2 { font:8.00pt "Arial", sans-serif; } .font3 { font:8.00pt "Times New Roman", serif; } .font4 { font:15.00pt "Times New Roman", serif; } V C:\MATl.Aft\wark\VropHm, m Q( Unconstrained nonlinear programming used to search an engine performance map for peak efficiency. Constrained Nonlinear Optimization Constrained nonlinear optimization problems are composed of nonlinear objective functions and may be subject to linear...
Open the catalog to page 4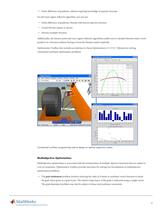
Optimization Toolbox 6.0 table.main {} tr.row {} td.cell {} div.block {} div.paragraph {} .font0 { font:5.00pt "Arial", sans-serif; } .font1 { font:7.00pt "Arial", sans-serif; } .font2 { font:9.00pt "Arial", sans-serif; } .font3 { font:8.00pt "Times New Roman", serif; } .font4 { font:15.00pt "Times New Roman", serif; } ■ Finite diffrence of gradients, without requiring knowledge of sparsity structure For the trust-region reflective algorithm, you can use: ■ Finite difference of gradients, Hessian with known sparsity structure ■ Actual Hessian (sparse or dense) ■ Hessian-multiply function Additionally,...
Open the catalog to page 5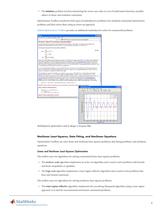
Optimization Toolbox 6.0 table.main {} tr.row {} td.cell {} div.block {} div.paragraph {} .font0 { font:5.00pt "Arial", sans-serif; } .font1 { font:7.00pt "Arial", sans-serif; } .font2 { font:8.00pt "Arial", sans-serif; } .font3 { font:9.00pt "Arial", sans-serif; } .font4 { font:8.00pt "Times New Roman", serif; } .font5 { font:15.00pt "Times New Roman", serif; } ■ The minimax problem involves minimizing the worst-case value of a set of multivariate functions, possibly subject to linear and nonlinear constraints. Optimization Toolbox transforms both types of multiobjective problems into standard...
Open the catalog to page 6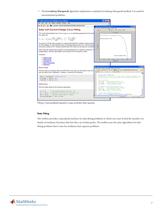
Optimization Toolbox 6.0 table.main {} tr.row {} td.cell {} div.block {} div.paragraph {} .font0 { font:5.00pt "Arial", sans-serif; } .font1 { font:7.00pt "Arial", sans-serif; } .font2 { font:8.00pt "Arial", sans-serif; } .font3 { font:8.00pt "Times New Roman", serif; } .font4 { font:15.00pt "Times New Roman", serif; } The Levenberg-Marquardt algorithm implements a standard Levenberg-Marquardt method. It is used for unconstrained problems. Fitting a transcendental quation using nonlinear least squares. Data Fitting The toolbox provides a specialized interface for data fitting problems in which...
Open the catalog to page 7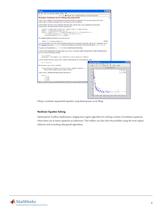
Optimization Toolbox 6.0 table.main {} tr.row {} td.cell {} div.block {} div.paragraph {} .font0 { font:5.00pt "Arial", sans-serif; } .font1 { font:7.00pt "Arial", sans-serif; } .font2 { font:8.00pt "Arial", sans-serif; } .font3 { font:8.00pt "Times New Roman", serif; } .font4 { font:15.00pt "Times New Roman", serif; } Fitting a nonlinear exponential quation using least-squares curve fitting. Nonlinear Equation Solving Optimization Toolbox implements a dogleg trust-region algorithm for solving a system of nonlinear quations where there are as many equations as unknowns. The toolbox can also solve...
Open the catalog to page 8All The MathWorks catalogs and technical brochures
 MATLAB Production Server
6 Pages
 Database Toolbox
4 Pages
 MATLAB Report Generator
4 Pages
 Stateflow
8 Pages
 SimEvents
7 Pages
 SimDriveline
7 Pages
 SimHydraulics
7 Pages
 SimPowerSystems
8 Pages
 Simulink Control Design
5 Pages
 Aerospace Blockset
5 Pages
 SimRF
SimRF6 Pages
 Simulink Coder
6 Pages
 Embedded Coder
8 Pages
 Simulink PLC Coder
4 Pages
 Fixed-Point Designer
9 Pages
 MATLAB Coder
5 Pages
 Simulink 3D Animation
10 Pages
 Gauges Blockset
2 Pages
 Simulink Report Generator
3 Pages
 Polyspace Bug Finder
6 Pages
 global-optimization-toolbox
10 Pages
 Phased Array System Toolbox
9 Pages
 OPC Toolbox
5 Pages
 Simulink Design Verifier
7 Pages
 Simulink Design Optimization
10 Pages
 Filter Design HDL Coder
5 Pages
 Bioinformatics Toolbox
9 Pages
 SimBiology
6 Pages
 Computer Vision System Toolbox
10 Pages
 DSP System Toolbox
11 Pages
 Fuzzy Logic Toolbox
5 Pages
 Polyspace Client for C/C++
5 Pages
 xPC Target
5 Pages
 SimMechanics
7 Pages
 Simscape
7 Pages
 Simulink
6 Pages
 Data Acquisition Toolbox
8 Pages
 Image Processing Toolbox
7 Pages
 Signal Processing Toolbox
10 Pages
 Control System Toolbox
6 Pages
 Symbolic Math Toolbox?
6 Pages
 Parallel Computing Toolbox?
7 Pages
 MATLAB®
6 Pages
 Mapping Toolbox 3.2
7 Pages
 Instrument Control Toolbox
7 Pages


Archived catalogs
 MATLAB Release Notes
505 Pages
 C and Fortran API Reference
263 Pages
 External Interfaces
649 Pages
 Function Reference: Volume 3 (P-Z)
1696 Pages
 Function Reference: Volume 2 (F-O)
1568 Pages
 Function Reference: Volume 1 (A-E)
1298 Pages
 Creating Graphical User Interfaces
520 Pages
 3-D Visualization
212 Pages
 Graphics
667 Pages
 MATLAB Programming Tips
66 Pages
 Programming Fundamentals
840 Pages
 Data Analysis
220 Pages
 Mathematics
316 Pages
 MATLAB® Getting Started Guide
250 Pages


- Automation software solution
- Management software solution
- Analysis software solution
- Process software
- Windows software
- Real-time software
- Computer-aided design software
- Cloud-based software
- Control software
- Design software solution
- 3D software solution
- Measurement software
- Visualization software solution
- Simulation software solution
- Automated software
- Programming software
- Network software
- Reporting software
- Engineering software
- Machine software