Group: Rohde & Schwarz

Catalog excerpts
R&S®FSQ Signal Analyzer Signal analysis and high-end spectrum a nalysis in one instrument
Open the catalog to page 1
R&S®FSQ Signal Analyzer At a glance The R&S®FSQ is the solution for all development and production measurement tasks. It offers very low phase noise, unsurpassed low residual EVM, a wide dynamic range and above-average accuracy, making it the ideal high-end measuring instrument for development applications, where tolerances and limit values must often be lower than defined in a standard. The ¸FSQ combines the outstanding spectrum analyzer features and functions of the ¸FSU with those of a wideband signal analyzer. Due to its large analysis bandwidth of up to 120 MHz (R&S®FSQ‑B72), the...
Open the catalog to page 2
R&S®FSQ Signal Analyzer Benefits and key features Excellent RF erformance for demanding p applications ❙❙ Outstanding RF features ■■ 84 dB ACLR for 3GPP with noise correction ■■ 77 dB ACLR for 3GPP multicarrier signals (four adjacent carriers) ■■ TOI > +20 dBm, typ. +25 dBm ■■ 1 dB compression +13 dBm ■■ Displayed average noise level (DANL) typ. –173 dBm using noise correction (1 Hz bandwidth) and R&S®FSU-B24 preamplifier ■■ Phase noise –160 dBc (1 Hz) at 10 MHz carrier offset ■■ Phase noise –133 dBc (1 Hz) at 10 kHz carrier offset ▷▷ page 4 S ignal and pectrum analysis in a single s...
Open the catalog to page 3
Excellent RF erformance p for demanding applications Outstanding RF features The dynamic range performance of a spectrum analyzer is mainly defined by three parameters: ❙❙ Noise level ❙❙ Intermodulation performance (TOI) ❙❙ Phase noise The R&S®FSQ excels in all of these three categories. Its wide dynamic range comes in handy when solving d ifficult measurement problems. The inherent noise level of the R&S®FSQ can be reduced by using noise correction. The instrument measures its own noise in the active operating mode, and then uses signal processing to remove the noise from the trace,...
Open the catalog to page 4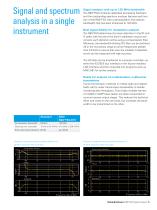
Signal and spectrum a nalysis in a ingle s instrument Signal analysis with up to 120 MHz bandwidth The R&S®FSQ combines dedicated processing hardware and the outstanding spectrum analyzer features and function of the R&S®FSU with a demodulation and analysis bandwidth that has been enhanced to 120 MHz. Best signal fidelity for modulation analysis The R&S®FSQ determines the linear distortion in the RF and IF paths with the aid of the built-in calibration source and corrects such distortion online using a compensation filter. Moreover, the bandwidth-limiting YIG filter can be switched...
Open the catalog to page 5
Application Transmitter and modulation measurements in mobile communications systems Measurement application/ technology R&S®FS-K10 ❙❙ GSM/EDGE/ EDGE Evolution/ VAMOS ❙❙ Power measurement in time domain including carrier power ❙❙ EVM ❙❙ Phase/frequency error ❙❙ Origin offset suppression ❙❙ Modulation spectrum – ❙❙ Transient spectrum ❙❙ Code domain power ❙❙ Code domain power versus time ❙❙ CCDF ❙❙ EVM ❙❙ Spectrum mask ❙❙ Channel table with ❙❙ Peak code domain error ❙❙ ACLR summary of channels ❙❙ Constellation diagram ❙❙ Power measurement used on base station ❙❙ Residual code domain ❙❙...
Open the catalog to page 6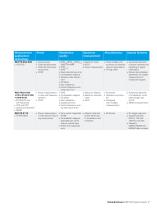
Measurement application/ technology ❙❙ Carrier power ❙❙ Code domain power ❙❙ Code domain power versus time ❙❙ CCDF R&S®FSQ-K100/ -K101/-K102/-K103/ -K104/-K105 ❙❙ EUTRA/LTE and LTE-Advanced ❙❙ TDD and FDD ❙❙ Uplink and downlink ❙❙ MIMO R&S®FS-K110 ❙❙ TETRA/TEDS ❙❙ RHOPilot/RHOData/RHOMAC (R&S®FSV-K84) ❙❙ RHOOverall ❙❙ EVM ❙❙ Peak code domain error ❙❙ Constellation diagram ❙❙ Residual code domain error ❙❙ I/Q offset ❙❙ Gain imbalance ❙❙ Center frequency error (chip rate error) ❙❙ Power measurement ❙❙ EVM in time and frequency ❙❙ Constellation diagram domains ❙❙ I/Q offset ❙❙ CCDF ❙❙ Gain...
Open the catalog to page 7
Application Transmitter and modulation measurements in ireless w communications systems Measurement application/ technology R&S®FS-K93 ❙❙ WiMAX™ ❙❙ IEEE 802.16e ❙❙ OFDM ❙❙ OFDMA Special features ❙❙ Output power ❙❙ Deviation ❙❙ Average and peak ❙❙ Initial carrier frequency power tolerance (ICFT) ❙❙ EDR relative TX power ❙❙ Carrier frequency drift ❙❙ EDR frequency stability ❙❙ EDR modulation accuracy ❙❙ Power measurement ❙❙ EVM in time and frequency ❙❙ Constellation diagram domains ❙❙ I/Q offset ❙❙ Rising/falling edge ❙❙ Gain imbalance ❙❙ CCDF ❙❙ Quadrature error ❙❙ Center frequency...
Open the catalog to page 8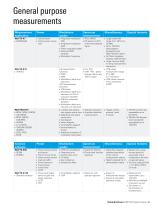
General purpose measurements Measurement application ❙❙ Carrier power ❙❙ Carrier power versus time ❙❙ Frequency modulation ❙❙ THD, SINAD (FM) ❙❙ RF spectrum (FFT) ❙❙ Amplitude modulation of the demodulated (AM) signal ❙❙ Phase modulation (φM) ❙❙ Peak and RMS deviation ❙❙ Modulation frequency Special features ❙❙ Large bandwidth range from 100 Hz to 28 MHz ❙❙ Up to 120 MHz demodulation bandwidth with ¸FSQ‑B72 ption o ❙❙ AF filters (highpass, lowpass, deemphasis) ❙❙ Large memory depth for long measurement sequences ❙❙ VOR phase measurement range: 0° to 360°, 0.1° resolution ❙❙ VOR...
Open the catalog to page 9
Application Phase noise and noise figure measurement The ¸FS-K40 application firmware for phase noise measurement automates measurement over a complete offset frequency range, and determines residual FM from the phase noise characteristic. In conjunction with the extremely low phase noise of the ¸FSQ, this eliminates in many cases the need for an extra phase noise measurement system that may be difficult to operate. The ¸FS-K30 application firmware for noise figure and gain measurements is a convenient tool for determining the noise figure of amplifiers and frequency-converting DUTs...
Open the catalog to page 10
Frequency range Reference frequency aging: 1 × 10 –7/year, with ¸FSU-B4 option: 2 × 10 –8 Spectral purity Phase noise typ. –133 dBc (1 Hz) at 10 kHz carrier offset, carrier frequency 500 MHz Sweep time Span > 10 Hz Span 0 Hz (zero span) 10 Hz to 50 MHz, FFT filter: 1 Hz to 30 kHz, channel filter, EMI bandwidth Display range DANL with preamplifier ON (¸FSU-B25), 1 GHz, 1 Hz RBW DANL with preamplifier ON (¸FSU-B23), 26 GHz, 1 Hz RBW Trace detectors Total measurement uncertainty, f < 3.6 GHz Display linearity Max Peak, Min Peak, Auto Peak, Sample, RMS, Average, Quasi Peak For data sheet, see...
Open the catalog to page 11All Rohde Schwarz catalogs and technical brochures
-
 R&S®FPC Spectrum analyzer
16 Pages
-
 R&S®ZNL vector network analyzer
18 Pages
-
 R&S®MXO 4 Oscilloscope
40 Pages
-
 R&S®RTE1000 oscilloscope
40 Pages
-
 R&S®FPL1000
20 Pages
-
 R&S®ZNA vector network analyzers
52 Pages
-
 R&S®HF907
2 Pages
-
 R&S®RO129 Antenna Rotator
6 Pages
-
 R&S®PR100 Portable Receiver
30 Pages
-
 R&S®ETC Compact TV Analyzer
12 Pages
-
 R&S®RSC Step Attenuator
10 Pages
-
 R&S®RTA4000 Oscilloscope
22 Pages
-
 R&S®NRP Power Meter Family
40 Pages
-
 R&S®EVSF1000
12 Pages
-
 R&S®UMS175
10 Pages
-
 R&S®AVHE100
24 Pages
-
 HM8030
2 Pages
-
 R&S®HMC8015 Power Analyzer
10 Pages
-
 R&S®HM8118 LCR-Bridge
2 Pages
-
 Digital Multimeter HMC8012
3 Pages
-
 Mobile network testing solutions
20 Pages
-
 Value Instruments Catalog
69 Pages
-
 Test & Measurement Catalog 2016
266 Pages
-
 R&S®BBA150 Broadband Amplifier
16 Pages
-
 R&S®UPZ Audio Switcher
6 Pages
-
 R&S®SMZ Frequency Multiplier
8 Pages
-
 Test & Measurement Catalog 2013/2014
214 Pages
-
 R&S®CMW-CU Control Unit
6 Pages
-
 R&S®FSU Spectrum Analyzer
16 Pages
-
 R&S®RTE-B1 Mixed Signal, 400 MHz
26 Pages
-
 R&S®RTO Digital Oscilloscopes
32 Pages
-
 R&S®ZVB Vector Network Analyzers
20 Pages
-
 R&S®IQR I/Q Data Recorde
16 Pages
-
 R&S®CMA180 Radio Test Set
16 Pages
-
 R&S®CBT/CBT32 Bluetooth® Tester
20 Pages
-
 R&S®UPV Audio Analyzer
24 Pages
-
 R&S®RTE Digital Oscilloscope
26 Pages
-
 R&S®TSMX-PPS2 GPS Module
4 Pages
-
 R&S®CMW500 Platform overview
20 Pages
-
 R&S®EM010 VXI HF Receiver
10 Pages
-
 EMC Precompliance Solutions
79 Pages
-
 UMS120 Monitoring Syste
8 Pages


Archived catalogs
-
 Network Operators Catalog
18 Pages
-
 Broadcasting Catalog
144 Pages
-
 Secure communication Catalog
274 Pages
-
 T & M Product Catalog
146 Pages
-
 R&S®RF Step Attenuators
2 Pages
-
 Q8384 Optical Spectrum Analyzer
10 Pages
-
 R&S®NRP Power Meter
22 Pages
-
 Audio Analyzers ¸UP 300/¸UP 350
16 Pages
-
 R&S®ZVL Vector Network Analyzers
14 Pages
-
 SMU200A Flyer
2 Pages
-
 SMU200A Vector Signal Generator
44 Pages
-
 R&S®EVS300 ILS/VOR Analyzer
12 Pages
-
 WiMAX Communication Tester
16 Pages


