Group: Spectris plc.

Catalog excerpts
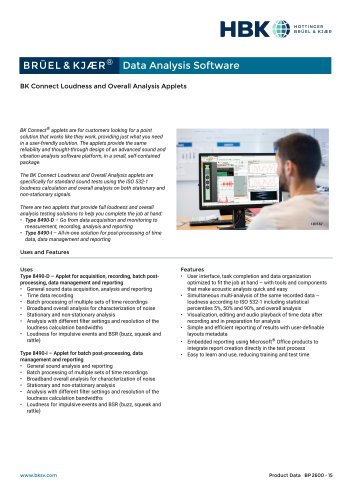
DIRAC PC software is used for measuring a wide range of room acoustical parameters. Based on the measurement and analysis of impulse responses, DIRAC supports a variety of measurement configurations. For accurate measurements according to the ISO 3382 standard, you can use internally or externally generated stimulus signals through a loudspeaker sound source. Survey measurements are easily carried out using a small impulsive sound source, such as a blank pistol or even a balloon. Speech intelligibility measurements can be carried out in compliance with the IEC 60268-16 standard through an artificial mouth-directional loudspeaker sound source, such as Echo Speech Source Type 4720 or through direct injection into a sound system, taking into account the impact of background noise. DIRAC is a valuable tool not only for field and laboratory acoustics engineers, but also for researchers and educational institutions. To learn more about DIRAC and its applications, please visit www.bksv.com/DIRAC. Uses and Features Uses • Measure the acoustics of any room, hall or space • Measure speech intelligibility • Check acoustics before and after modification • Compare acoustics of different rooms • Scale model measurements • Test and validate sound systems • Research and education on acoustics • Troubleshooting room acoustics Features • Dual-channel room acoustics • Compliant with ISO 3382 (room acoustics), ISO 18233 (analysis methods) and IEC 60268-16 (speech intelligibility) • Quick and easy measurements using an optional calibrated speech source (Echo Speech Source Type 4720) • Time reverse filtering to measure short reverberation times • Impulse response editing with unlimited undo • Auto Measure for large rooms • Predefined and user-defined parameters • Auralisation of any sound played in a room, using the room's impulse response • Comparisons and statistics of results
Open the catalog to page 1
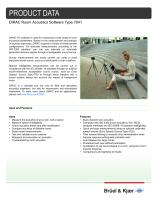
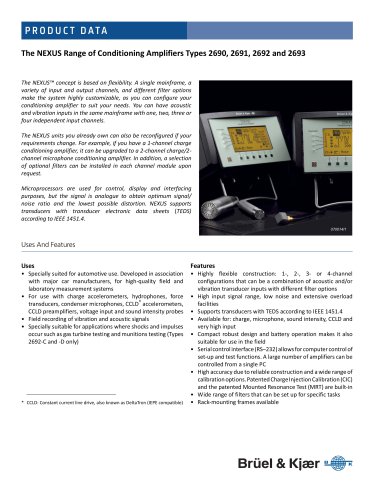
About DIRAC Fig. 1 Basic principle of impulse response measurement To investigate the acoustical properties of a room, you can clap your hands and listen to the response of the room. Although it may not be easy to describe accurately what you hear, this method gives you an impression of whether music would sound pleasant or speech would be intelligible in this room. DIRAC uses this principle as the basis for measuring the acoustical properties of a system through impulse responses. Processing Unit Receiver Impulse Responses Sound Source The mathematical impulse or Dirac delta function,...
Open the catalog to page 2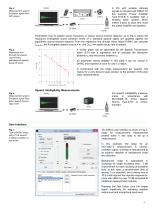
Fig. 4 Measurement system: Excitation signal from MP3 player A CD with suitable stimulus signals is included with DIRAC for this purpose. Power Amplifier Type 2734-B is available with a wireless audio system, which makes it easy to place and move the power amplifier and speaker. DIRAC White Power Amplifier Type 2734 Parameters may be plotted versus frequency or versus source-receiver distance, as in Fig. 5, where the measured A-weighted sound pressure levels of a standard speech signal are graphed against the logarithmic source-receiver distance. From the regression line through these...
Open the catalog to page 3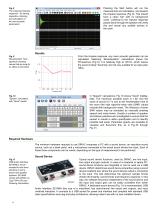
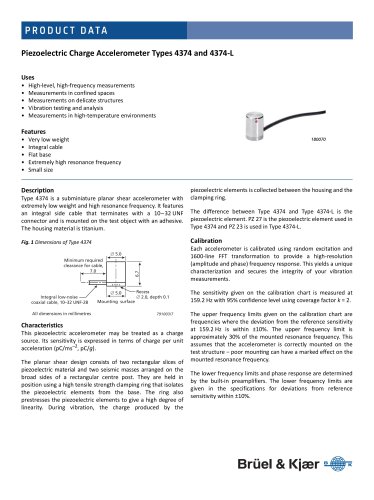
Pressing the Start button will run the measurement and calculation, and present the impulse response (Fig. 8). This should have a clean “tail” with no background noise. Listening to the impulse response played back through the speaker will verify this and reveal any audible echoes in the room. Fig. 8 The measured impulse response – for saving, inspection, listening and calculation of all room acoustic parameters Results From the impulse response, any room acoustic parameter can be calculated. Selecting “Reverberation” calculations shows the RT spectrum (Fig. 9). It is relatively high at 125...
Open the catalog to page 4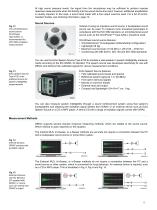
At high sound pressure levels, the signal from the microphone may be sufficient to perform impulse response measurements when fed directly into the sound device line input; however, additional amplification is usually required. In this case, a sound level meter with a line output could be used. For a list of recommended models, see Ordering Information, page 12. Sound Sources Instead of using an impulsive sound source, a loudspeaker sound source can be used. To measure room acoustical parameters in compliance with the ISO 3382 standard, an omnidirectional sound source such as the OmniPower™...
Open the catalog to page 5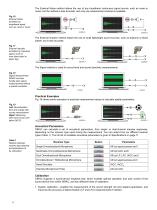
The External Noise method allows the use of any broadband continuous signal source, such as noise or music, but the method is less accurate, and only one measurement channel is available. Fig. 16 External Noise: excitation by broadband signal, such as noise or music 020062/1 The External Impulse method allows the use of small lightweight sound sources, such as balloons or blank pistols, but is less accurate. Fig. 17 External Impulse: excitation by impulsive signal, such as from blank pistol or paper bag 020064/1 The Signal method is used for sound level and sound directivity measurements....
Open the catalog to page 6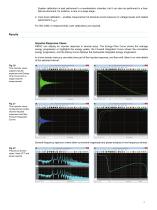
System calibration is best performed in a reverberation chamber, but it can also be performed in a freefield environment, for instance, in situ on a large stage. 2. Input level calibration – enables measurement of absolute sound pressure (or voltage) levels and related parameters (Leq,I). For ISO 3382–3 measurements, both calibrations are required. Results Impulse Response Views DIRAC can display an impulse response in several ways. The Energy-Time Curve shows the average energy progression or highlights the energy peaks, the Forward Integration Curve shows the cumulative energy...
Open the catalog to page 7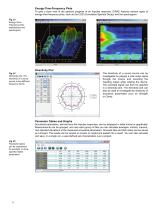
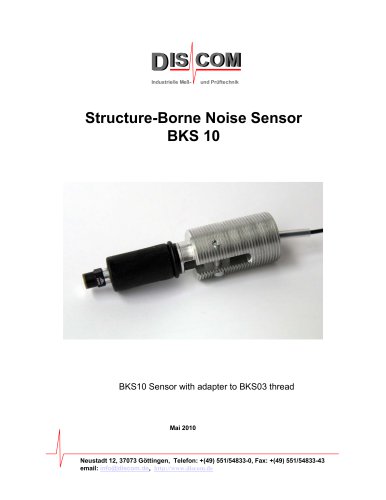
Energy-Time-Frequency Plots To give a clear view of the spectral progress of an impulse response, DIRAC features several types of energy-time-frequency plots, such as the CSD (Cumulative Spectral Decay) and the spectrogram. Fig. 23 Energy-TimeFrequency plots: waterfall plot and spectrogram Directivity Plot The directivity of a sound source can be investigated by playing a pink-noise signal through the source and recording the resulting output while rotating the device. The recorded signal can then be graphed in a directivity plot. The directivity plot can also be used to investigate the...
Open the catalog to page 8All Bruel and Kjaer catalogs and technical brochures
-
 Data Analysis Software
6 Pages
-
 B&K 2245 Sound Level Meter
8 Pages
-
 HBK 2255 Sound Level Meter
10 Pages
-
 Artificial Mastoid Type 4930
6 Pages
-
 Power Amplifier Type 2718
2 Pages
-
 DISCOM Mobile
6 Pages
-
 DISCOM NVH Analysis Systems
4 Pages
-
 TEDS Microphones
8 Pages
-
 LDS V8
4 Pages
-
 LDS Comet USB
4 Pages
-
 LDS Laser USB
16 Pages
-
 2690-A
16 Pages
-
 4374
43742 Pages
-
 4326-A-001
8 Pages
-
 4152
41524 Pages
-
 4191
41912 Pages
-
 2719
27192 Pages
-
 LDS V8900
4 Pages
-
 BKS 10
8 Pages
-
 1704-A-001
4 Pages
-
 4939
49392 Pages
-
 4138
41384 Pages
-
 4101-B and 4965-B
4 Pages
-
 Sonoscout NVH Recorder
8 Pages
-
 LDS Power Amplifiers
8 Pages
-
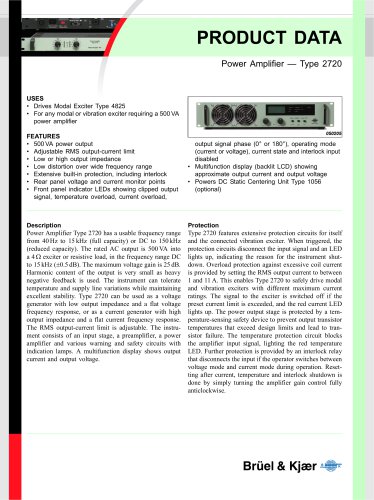 Type 2720
2 Pages
-
 Type 2721
2 Pages
-
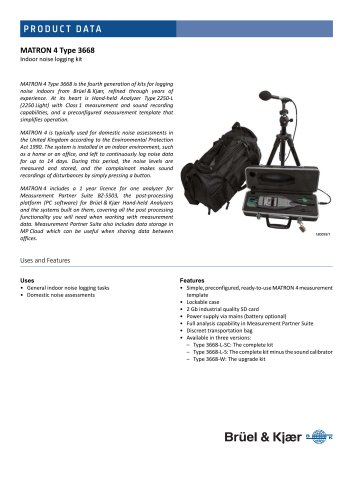 TYPE 3668
4 Pages
-
 3656-A
4 Pages
-
 TYPE 2270-S
28 Pages
-
 LDS V994
2 Pages
-
 TYPE 8702
16 Pages
-
 BZ-7848-A
40 Pages
-
 TYPE 9718-A:bp0317
12 Pages
-
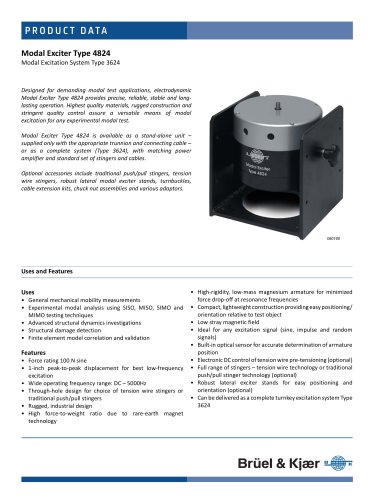 TYPE 4824:bp1936
4 Pages
-
 SOUND LEVEL METER:bp 2025
28 Pages
-
 Transducers and conditioning
188 Pages
-
 Noise Sentinel Overview
3 Pages
-
 Analyzer Catalogue
39 Pages
-
 Noise Logger Type 3659
1 Pages
-
 Sound level meters
17 Pages