- Catalogs
- Alphasense
- Oxygen 3-Year Warranty Sensor
- Company
- Products
- Catalogs
- News & Trends
- Exhibitions
Oxygen 3-Year Warranty Sensor
1 /2Pages

Oxygen 3-Year Warranty Sensor
1 /2Pages
Catalog excerpts
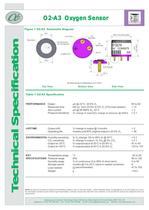
Figure 1 O2-A3 Schematic Diagram > All dimensions in millimetres ( 0.1mm) Top ViewBottom ViewSide View Table 1 O2-A3 Specification PERFORMANCE OutputѵA @ 22C, 20.9% O > 2 65 to 82Response timet90 (s) from 20.9% to 0% O > 2 (47 ТĦ load resistor)< 15Zero currentA @ 99.999% N > 2 , 22հC< 3Pressure sensitivity > (% change of output)/(% change of pressure) @ 20kPa < 0.1 LIFETIME Output drift% change in output @ 3 months< 2Operating lifemonths until 85% original output in 20.9% O > 2 > 36 ENVIRONMENTAL Humidity sensitivity% O > 2 change: 0% to 95% rh @ 40C< 0.7CO > 2 sensitivity% change in output / % CO > 2 @ 5% CO > 2 + 0.1Output at -20аC% output/output at 20C in 20.9% O > 2 87 to 93Output at +50аC% output/output at 20C in 20.9% O > 2 103 to 107 KEY Temperature rangeаC-30 to 55 SPECIFICATIONS Pressure rangekPa80 to 120Humidity range% rh continuous (0 to 99% rh short term)5 to 95Storage periodmonths @ 3 to 20C (store in sealed container)6Load resistor > (recommended)47 to 100Weightg<16.5 > NOTE: all sensors are tested at ambient environmental conditions, with 47 ohm load resistor, unless otherwise stated. As applications of use are outside our control,the information provided is given without legal responsibility. Customers should test under their own conditions, to ensure that the sensors are suitable for their ownrequirements. TTTTTececececechnical Specifhnical Specifhnical Specifhnical Specifhnical Specificaicaicaicaicationtiontiontiontion Alphasense Ltd, Sensor Technology House, 300 Avenue West, Skyline 120, Great Notley. CM77 7AA. UKTelephone: +44 (0) 1376 556 700 Fax: +44 (0) 1376 335 899 E-mail: [email protected] Website: www.alphasense.com size="-3">
Open the catalog to page 1
Figure 2 TemperaturePerformance Figure 3 Pressure StepPerformance Figure 2 shows the variationof output caused by changes in temperature in 20.9% oxygen.All capillary oxygen sensorsshow a change in signal with temperature, and the very repeatable 95% confidence intervals for the O2-A3 are shown. Figure 4: shows how the Familyof Alphasense oxygen sensors respond to a 10kPa pressure step.Sensors with lower outputsand longer lifetime show greater output transients, but are predictable and repeatable. > o C Figure 3 shows how a 25 kPapressure step change causes a signal transient that decays reproducibly....
Open the catalog to page 2All Alphasense catalogs and technical brochures


Archived catalogs
 CL2-A1 Chlorine Sensors
2 Pages
 CL2-B1 Chlorine Sensors
2 Pages
 CH-A3 Flammable Gas Sensors
2 Pages
 CH-D3 Flammable Gas Sensors
2 Pages
 D2 Miniature Sensors
4 Pages
 NO-A1 Nitric Oxide Sensors
2 Pages
 NO-B1 Nitric Oxide Sensors
2 Pages
 4-20mA Transmitter Boards
2 Pages
 CO2-D1
2 Pages
 NDIR Transmitter Board
1 Page
 ISB Individual Sensor Board
2 Pages
 AFE Sensor Board
2 Pages
 SO2-B4
2 Pages
 SO2-A4
2 Pages
 PID-AH
2 Pages
 PID-A1
2 Pages
 O3-B4
O3-B42 Pages
 O3-A4
O3-A42 Pages
 NO2-B4
2 Pages
 NO2-A4
2 Pages
 NO-B4
NO-B42 Pages
 NO-A4
NO-A42 Pages
 IRM-AT Methane
2 Pages
 IRC-AT Carbon Dioxide
2 Pages
 IRC-A1 Carbon Dioxide
3 Pages
 H2S-B4
2 Pages
 H2S-A4
2 Pages
 CO-B4
CO-B42 Pages
 CO-A4
CO-A42 Pages
 OX-B431 Oxidising Gas Sensor
4 Pages
 OX-A431 Oxidising Gas Sensor
4 Pages
 Carbon Monoxide Sensor
2 Pages
 COH-A2
4 Pages
 Dual Sensor
4 Pages
 CO-AX
CO-AX2 Pages
 SOH-A2
4 Pages
 CL2-A1 Chlorine Sensor
2 Pages
 CL2-B1 Chlorine Sensor
2 Pages
 CL2-D4 Chlorine Sensor
2 Pages
 Hydrogen Sulfide Sensor
2 Pages
 VOC Sensor
2 Pages
 CO-AE
CO-AE2 Pages
 CO-AF
CO-AF2 Pages
 CO-BF
CO-BF2 Pages
 CO-BX
CO-BX2 Pages
 CO-CE
CO-CE2 Pages
 Combustible LEL Sensor
2 Pages
 Nitrogen Dioxide sensor
2 Pages
 NDIR CO2 Sensor
4 Pages


- Gas sensor
- Humidity and temperature probe
- Relative humidity and temperature sensor
- Environmental monitoring system
- Electrochemical gas sensor
- Air humidity and temperature probe
- Monitoring gas sensor
- Gas transmitter
- NDIR gas sensor
- Electrochemical oxygen sensor
- Particle counter
- CO gas sensor module
- CO2 gas sensor module
- CH4 gas sensor module
- Circuit board
- Volatile organic compound sensor
- Miniature gas sensor
- Analog gas transmitter
- Electrochemical sensor